
Title page
Decoding the evolution and transmissions of the novel pneumonia coronavirus (SARS-CoV-2) using whole genomic data
Wen-Bin Yu1,2 * Ph.D., Guang-Da Tang3,4 Ph.D., Li Zhang5 Ph.D., Richard T. Corlett1,2 Ph.D.
1Center for Integrative Conservation, Xishuangbanna Tropical Botanical Garden, Chinese Academy of Sciences, Mengla, Yunnan 666303, China
2Center of Conservation Biology, Core Botanical Gardens, Chinese Academy of Sciences, Mengla, Yunnan 666303, China
3Henry Fok College of Biology and Agriculture, Shaoguan University, Shaoguan 512005, China 4College of Forestry and Landscape Architecture, South China Agricultural University, Guangzhou 510642, China
5Chinese Institute for Brain Research, Beijing 102206, China
* Author for corresponding: yuwenbin@xtbg.ac.cn
1
chinaXiv:202002.00033v2
Summary
Background The outbreak of COVID-19 started in mid-December 2019 in Wuhan, Central China. Up to February 19, 2020, SARS-CoV-2 has infected more than 75,000 people in China, and another 25 countries across five continents. In this study, we used 93 complete genomes of SARS-CoV-2 from the GISAID EpiFluTM database to investigate the evolution and human-to-human transmissions of SARS-CoV-2 in the recent two months.
Methods Haplotype analyses were conducted on the alignment of coding regions using DnaSP. Evolutionary analysis of haplotypes used NETWORK. Population size changes were estimated using both DnaSP and Arlequin. Expansion date of population size was calculated based on the expansion parameter tau (τ) using the formula t=τ/2u.
Findings Eight coding-regions have 120 substitution sites, including 79 non-synonymous and 40 synonymous substitutions. Forty-two non-synonymous substitutions changed the biochemical property of amino acids. No combinations were detected. Fifty-eight haplotypes were classified into five groups: 31 haplotypes were found in samples from China and 31 in samples from other countries. The rooted network suggested that H13 and H35 were ancestral haplotypes, and H1 (which with its descendants included all samples from the Hua Nan market) was derived from the H3 haplotype. Population size of SARS-CoV-2 was estimated to have had a recent expansion on 6 January 2020, and an early expansion on 8 December 2019.
Interpretation Genomic variations of SARS-CoV-2 are still low in comparisons with published genomes of SARS-CoV and MERS-CoV. Phyloepidemiologic analyses suggested that the SARS-CoV-2 source at the Hua Nan market was imported from elsewhere. The crowded market then boosted SARS-CoV-2 circulation and spread it to the whole city in early December 2019. Furthermore, phyloepidemiologic approaches have recovered specific directions of human-to-human transmissions and the sources for international infected cases.
Funding Ten Thousand Talents Program of Yunnan, and Chinese Academy of Sciences.
2
chinaXiv:202002.00033v2
Evidence before this study
Up to February 19, 2020, SARS-CoV-2 had infected more than 75,000 people worldwide. Tracing back to the first identified COVID-19 patient on 1 December, SARS-CoV-2 has been circulated in humans for more than two months. However, it is still unclear whether the Hua Nan market was the birthplace of the virus, and how it has been transmitted and spread subsequently. We searched PubMed, preprint archives, and Google Scholar for articles published up to February 18, 2020, that contained information about the COVID-19 outbreak using the terms “2019-nCoV” or “SARS-CoV-2”, “coronavirus”, “evolution” or “phylogeny”, “GISAID”, “seafood market”, “transmission”, and “Wuhan”. We found six studies using fewer than 55 genomes of SARS-CoV-2 for phylogenetic analyses and molecular dating using BEAST.
Added value of this study
We found that 120 substitution sites were evenly distributed in eight coding regions, without evident recombination events. An earlier expansion date could be traced back to 8 December 2019. Genomic evidence did not support the Hua Nan market as the birthplace of SARS-CoV-2. In the first two months, most infected people were linked to Wuhan, but some infected patients outside China may link to Guangdong or other places.
Implications of all the available evidence
We suggest that SARS-CoV-2 may have already circulated widely among humans in Wuhan before December 2019, probably beginning in mid to late November. Some infected patients may have been overlooked because they had mild symptoms. We have demonstrated that a phylogenetic approach can be incorporated into epidemiological studies to search for the original source of SARS-CoV-2 and identify the direction of human-to-human transmissions.
3
chinaXiv:202002.00033v2
Introduction
Betacoronaviruses are characterized by enveloped, positive-sense, single-stranded RNA, and hosted in animals, particularly in mammals.1 Before December 2019, four species/strains of Betacoronavirus, HKU1, MERS-CoV, OC43 and SARS-CoV, had been reported to cause severe human diseases.1 The fifth species/strain, a novel betacoronavirus SARS-CoV-22 causing human pneumonia (i.e. COVID-19), was first reported in Wuhan, Hubei, Central China.3,4 Up to February 19, 2020, SARS-CoV-2 has infected more than 75,000 people in all provinces/regions of China, and another 25 countries across Africa, Asia, Europe, North America, and Oceania.5 Because SARS-CoV-2 can transmit from human to human,6 the massive exodus of people before the Chinese Spring Festival boosted the infection frequencies, as predicted.7 Daily confirmed infection cases were more than 2,000 between January 30 and 16 February 16, 2020, and the highest was more than 15,100,5 almost twice the total number of infection cases of SARS-CoV.8
As a member of subgenus Sarbecovirus, SARS-CoV-2 has been suggested to be of bat origin,3,9 and may have been transmitted to humans through non-bat intermediate mammals (e.g. pangolins10). Medical information for the first 41 infected patients in Wuhan showed that 27 patients were linked to the Hua Nan seafood market,6,11 which sold living wild mammals. This suggests a high possibility that SARS-CoV-2 originated in the market, then the infected people transmitted it to other people out of the market. However, this conclusion has been debated because the first identified infected person and 12 others had no link to the Hua Nan market. Some researchers have therefore argued that the Hua Nan market was not the original and/or only source of SARS-CoV-2 transmission to humans.12 The market was closed on 1 January 2020, making it very difficult to identify the intermediate animal vectors of SARS-CoV-2. In the absence of information on potential intermediary reservoirs, the origin and transmission pattern of SARS-CoV-2 are still unresolved.
Since the outbreak of COVID-19 was first identified in Wuhan in mid-December 2019, the first infected individuals identified in other provinces and regions of China, and other countries, during January 2020, have been assumed to have been infected in Wuhan or through contact with people from Wuhan.13-16 For example, the first identified infected patient and his four family members from Shenzhen visited Wuhan between Dec 29, 2019 and Jan 4, 2020,13 and the first identified infected patient in the United States visited family in Wuhan and returned to Washington State on January 15, 2020.14 SARS-CoV-2 can transmit from human to human,6 so Wuhan has been assumed to be the birthplace of SARS-CoV-2. However, this assumption has not been fully validated because the Hua Nan market has not been confirmed as the single source of SARS-CoV-2 transmission to humans and other possible original sources of SARS-CoV-2 have not been identified in Wuhan yet. It is evident, however, that the Hua Nan market boosted SARS-CoV-2 transmission to humans at an early stage of the pneumonia outbreak in Wuhan, after
which it spread rapidly with infected travelers to the whole of China and to other countries. 4
chinaXiv:202002.00033v2
In this study, we used 93 genomes of SARS-CoV-2 from the GISAID EpiFluTM database17 (access date 12 February 2020) to decode the evolution and transmissions of SARS-CoV-2 in the recent two months. Our aims were to: 1) characterize genomic variations of SARS-CoV-2; 2) infer the evolutionary relationships of the worldwide samples; and 3) deduce the transmission history of SARS-CoV-2 in Wuhan and out of Wuhan to the world.
Methods
To decode the evolutionary history of SARS-CoV-2, we retrieved 96 complete genomes from GISAID (Table S1, access by 12 February, 2020).17 The genome EPI_ISL_402131 (bat-RaTG13-CoV, hereafter) from GISAID was also included as the outgroup, because it is the closest sister betacoronavirus to SARS-CoV-2.3 The 97 genome sequences were aligned using MAFFT,18 then the alignment was manually checked using Geneious (Biomatters, New Zealand). In the alignment, we found that the genome EPI_ISL_404253 contains six ambiguous sites at variable positions and EPI_ISL_407079 and EPI_ISL_408978 have 175 “N” and 1,476 “N” bases, respectively, so these three genomes were excluded in this study. In addition, four genomes (EPI_ISL_407071, EPI_ISL_407894, EPI_ISL_407896, and EPI_ISL_409067) have their own private ambiguous sites, which were conservatively replaced by the common nucleotide at that position in the alignment. In the alignment, the 5’UTR and 3’UTR contain missing and ambiguous sites, so both regions were excluded in the following analyses.
The alignment was then imported into DnaSP19 for haplotype analyses. Population size changes were estimated based on a constant population size hypothesis using DnaSP, in combination with neutrality tests (Tajima’s D and Fu’s Fs). We also used Arlequin20 to test the sudden population expansion hypothesis and to calculate the expansion parameter tau (τ) if sudden population expansion is not rejected. We used the formula t=τ/2u to estimate the time since expansion (in days). In the formula, u is the cumulative substitution rate per year (for the genome sequence, so we used the formula u = μk to calculate it, where μ is the substitution rate per site per year, and k is the genome sequence length (29,358 bp for the CDS matrix). In this study, the substitution rate was set as 0·92×10-3 (95% CI, 0·33×10-3-1·46×10-3) substitution/site/year based on the most recent estimation for SARS-CoV-2.21 A median-joining network of haplotypes was generated by the NETWORK program22 with bat-RaTG13-CoV as the outgroup. Phylogenomic analyses of haplotypes were performed using IQ-TREE23. We conducted likelihood mapping and SH-like approximate likelihood ratio tests to assess the phylogenetic information and branch supports, respectively.
Results and discussion
Genomic variations of SARS-CoV-2
Genome size of SARS-CoV-2 varied from 29,782 bp to 29,903 bp. The aligned matrix was 29,910
5
chinaXiv:202002.00033v2
bp in length including 140 variable sites. The coding regions contained 120 substitution sites (Figure S1), which were classified as 58 haplotypes (Table S2). Nucleotide diversity (Pi) was 0·15×10-3±0·02×10-3 (Standard Deviation, SD, hereafter). Haplotype diversity (Hd) was 0·953±0·016 (SD) and variance of Hd was 0·26×10-3.
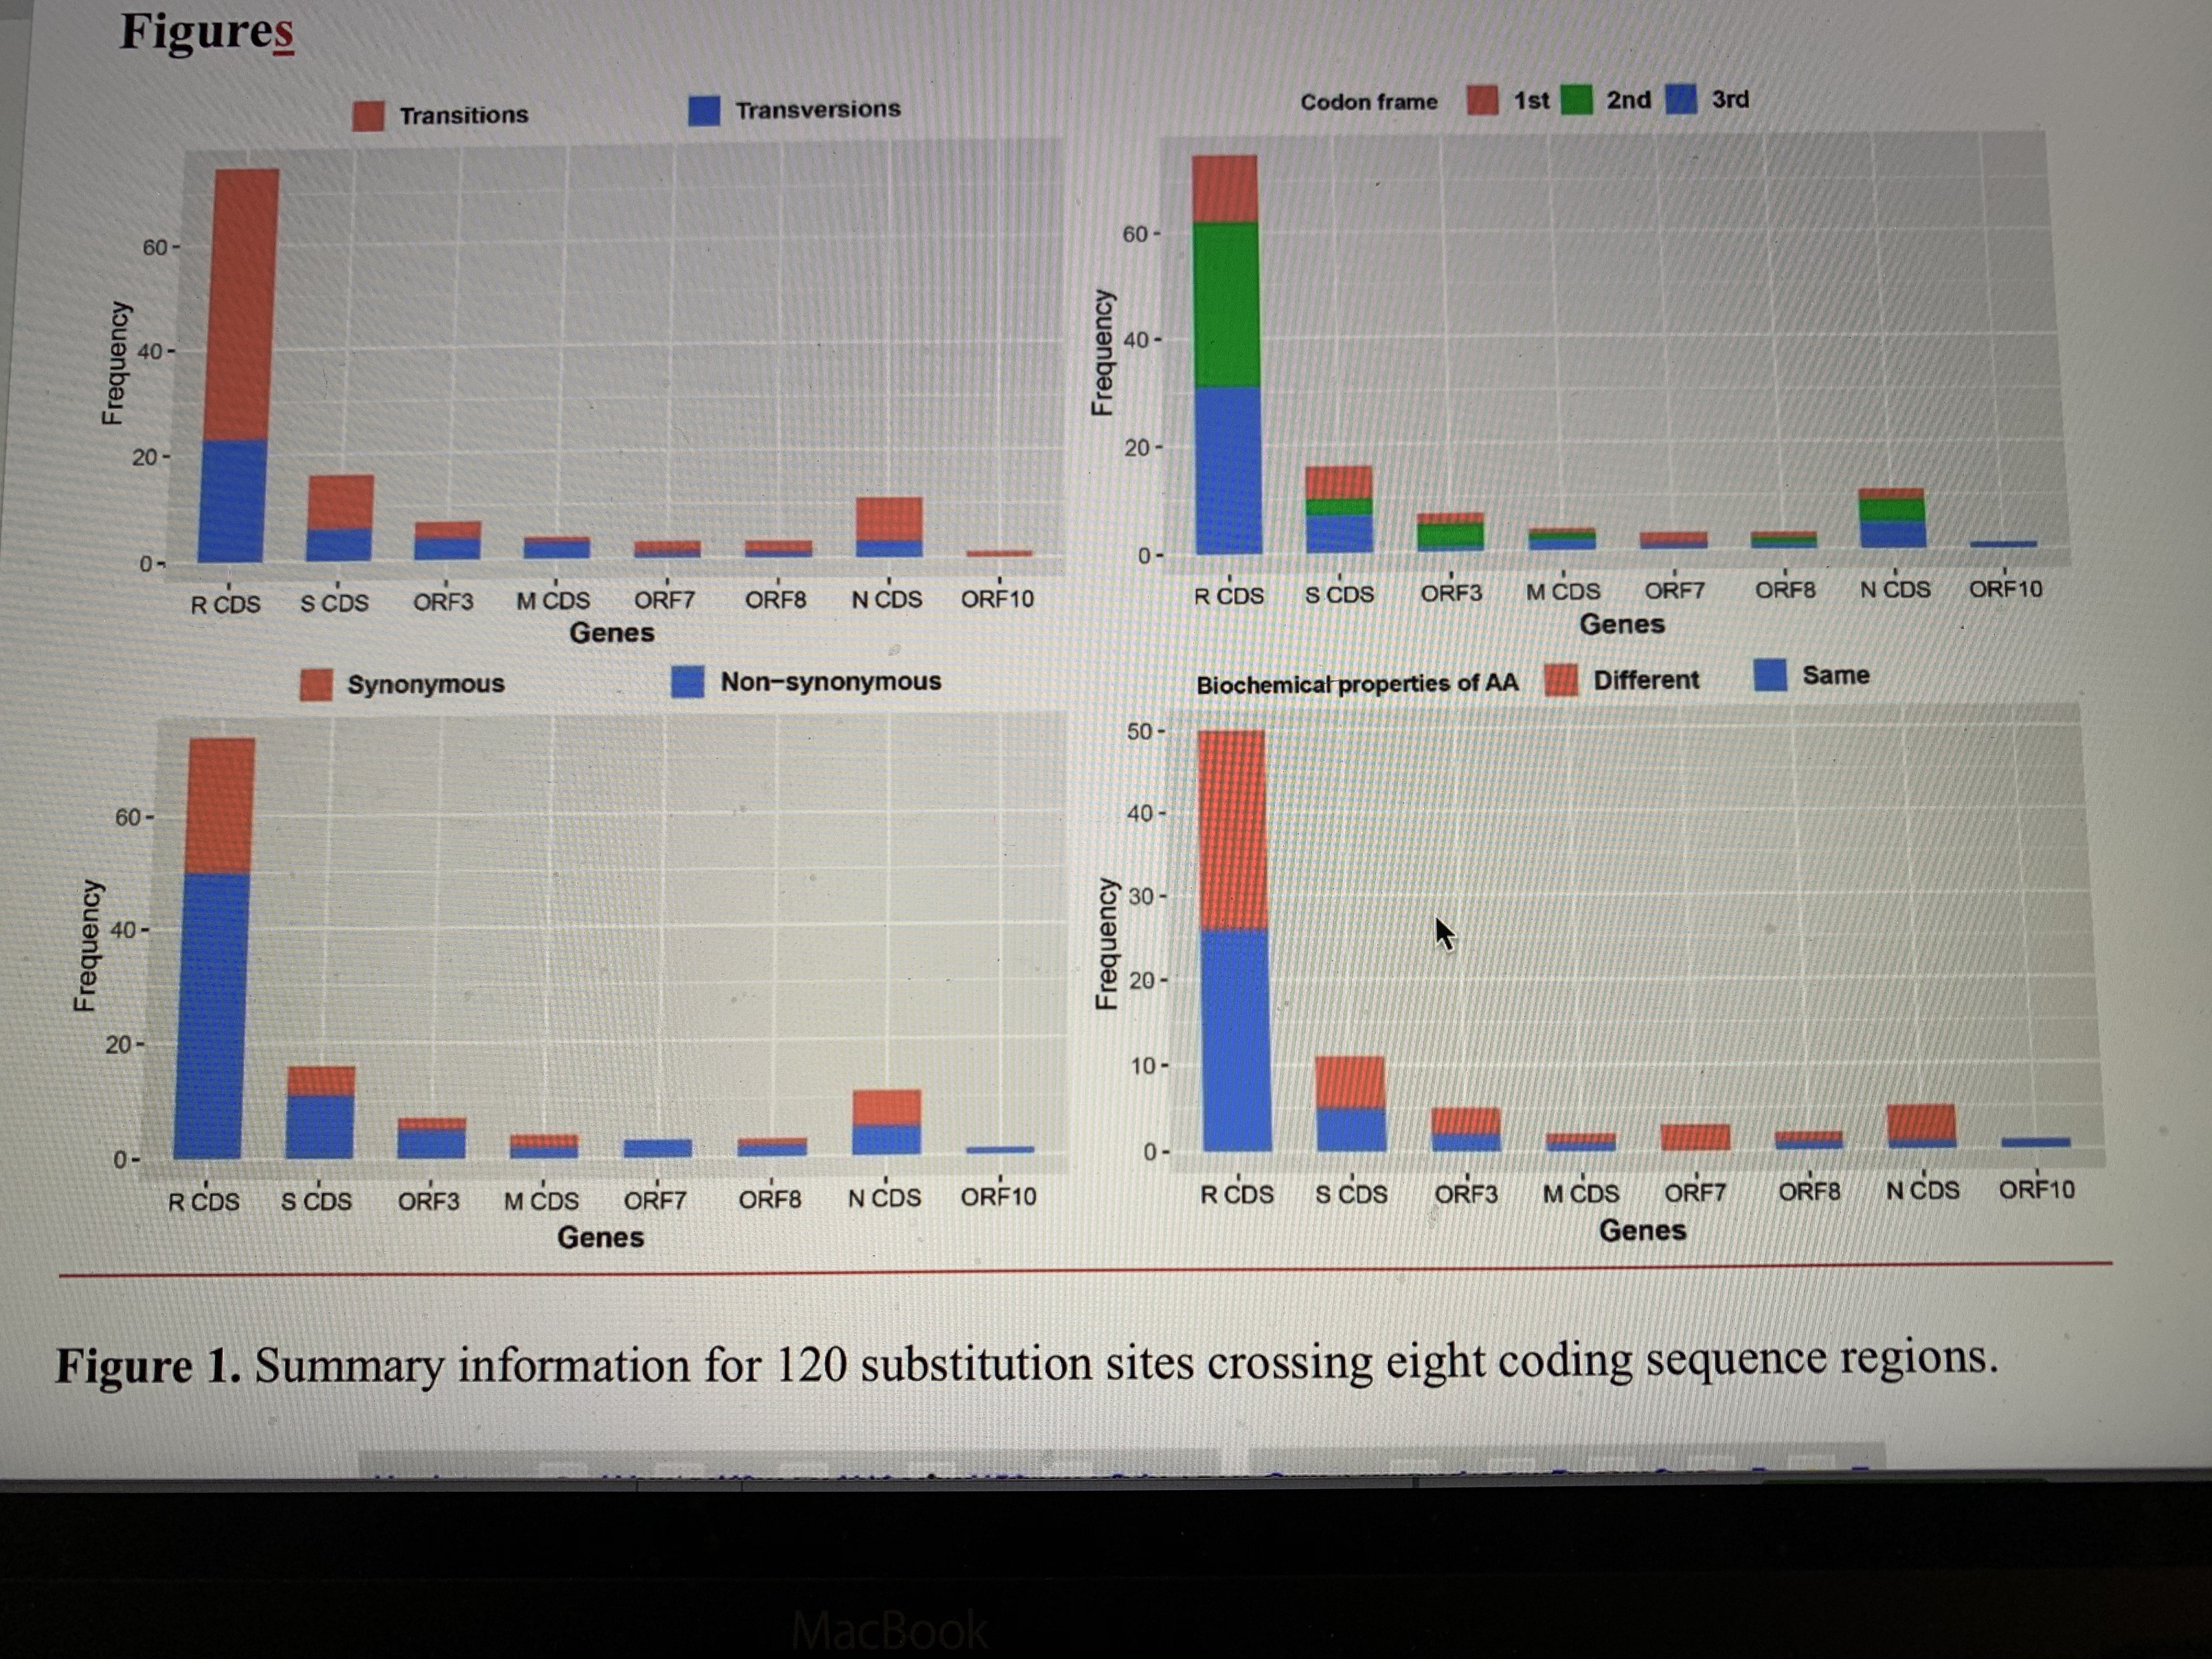
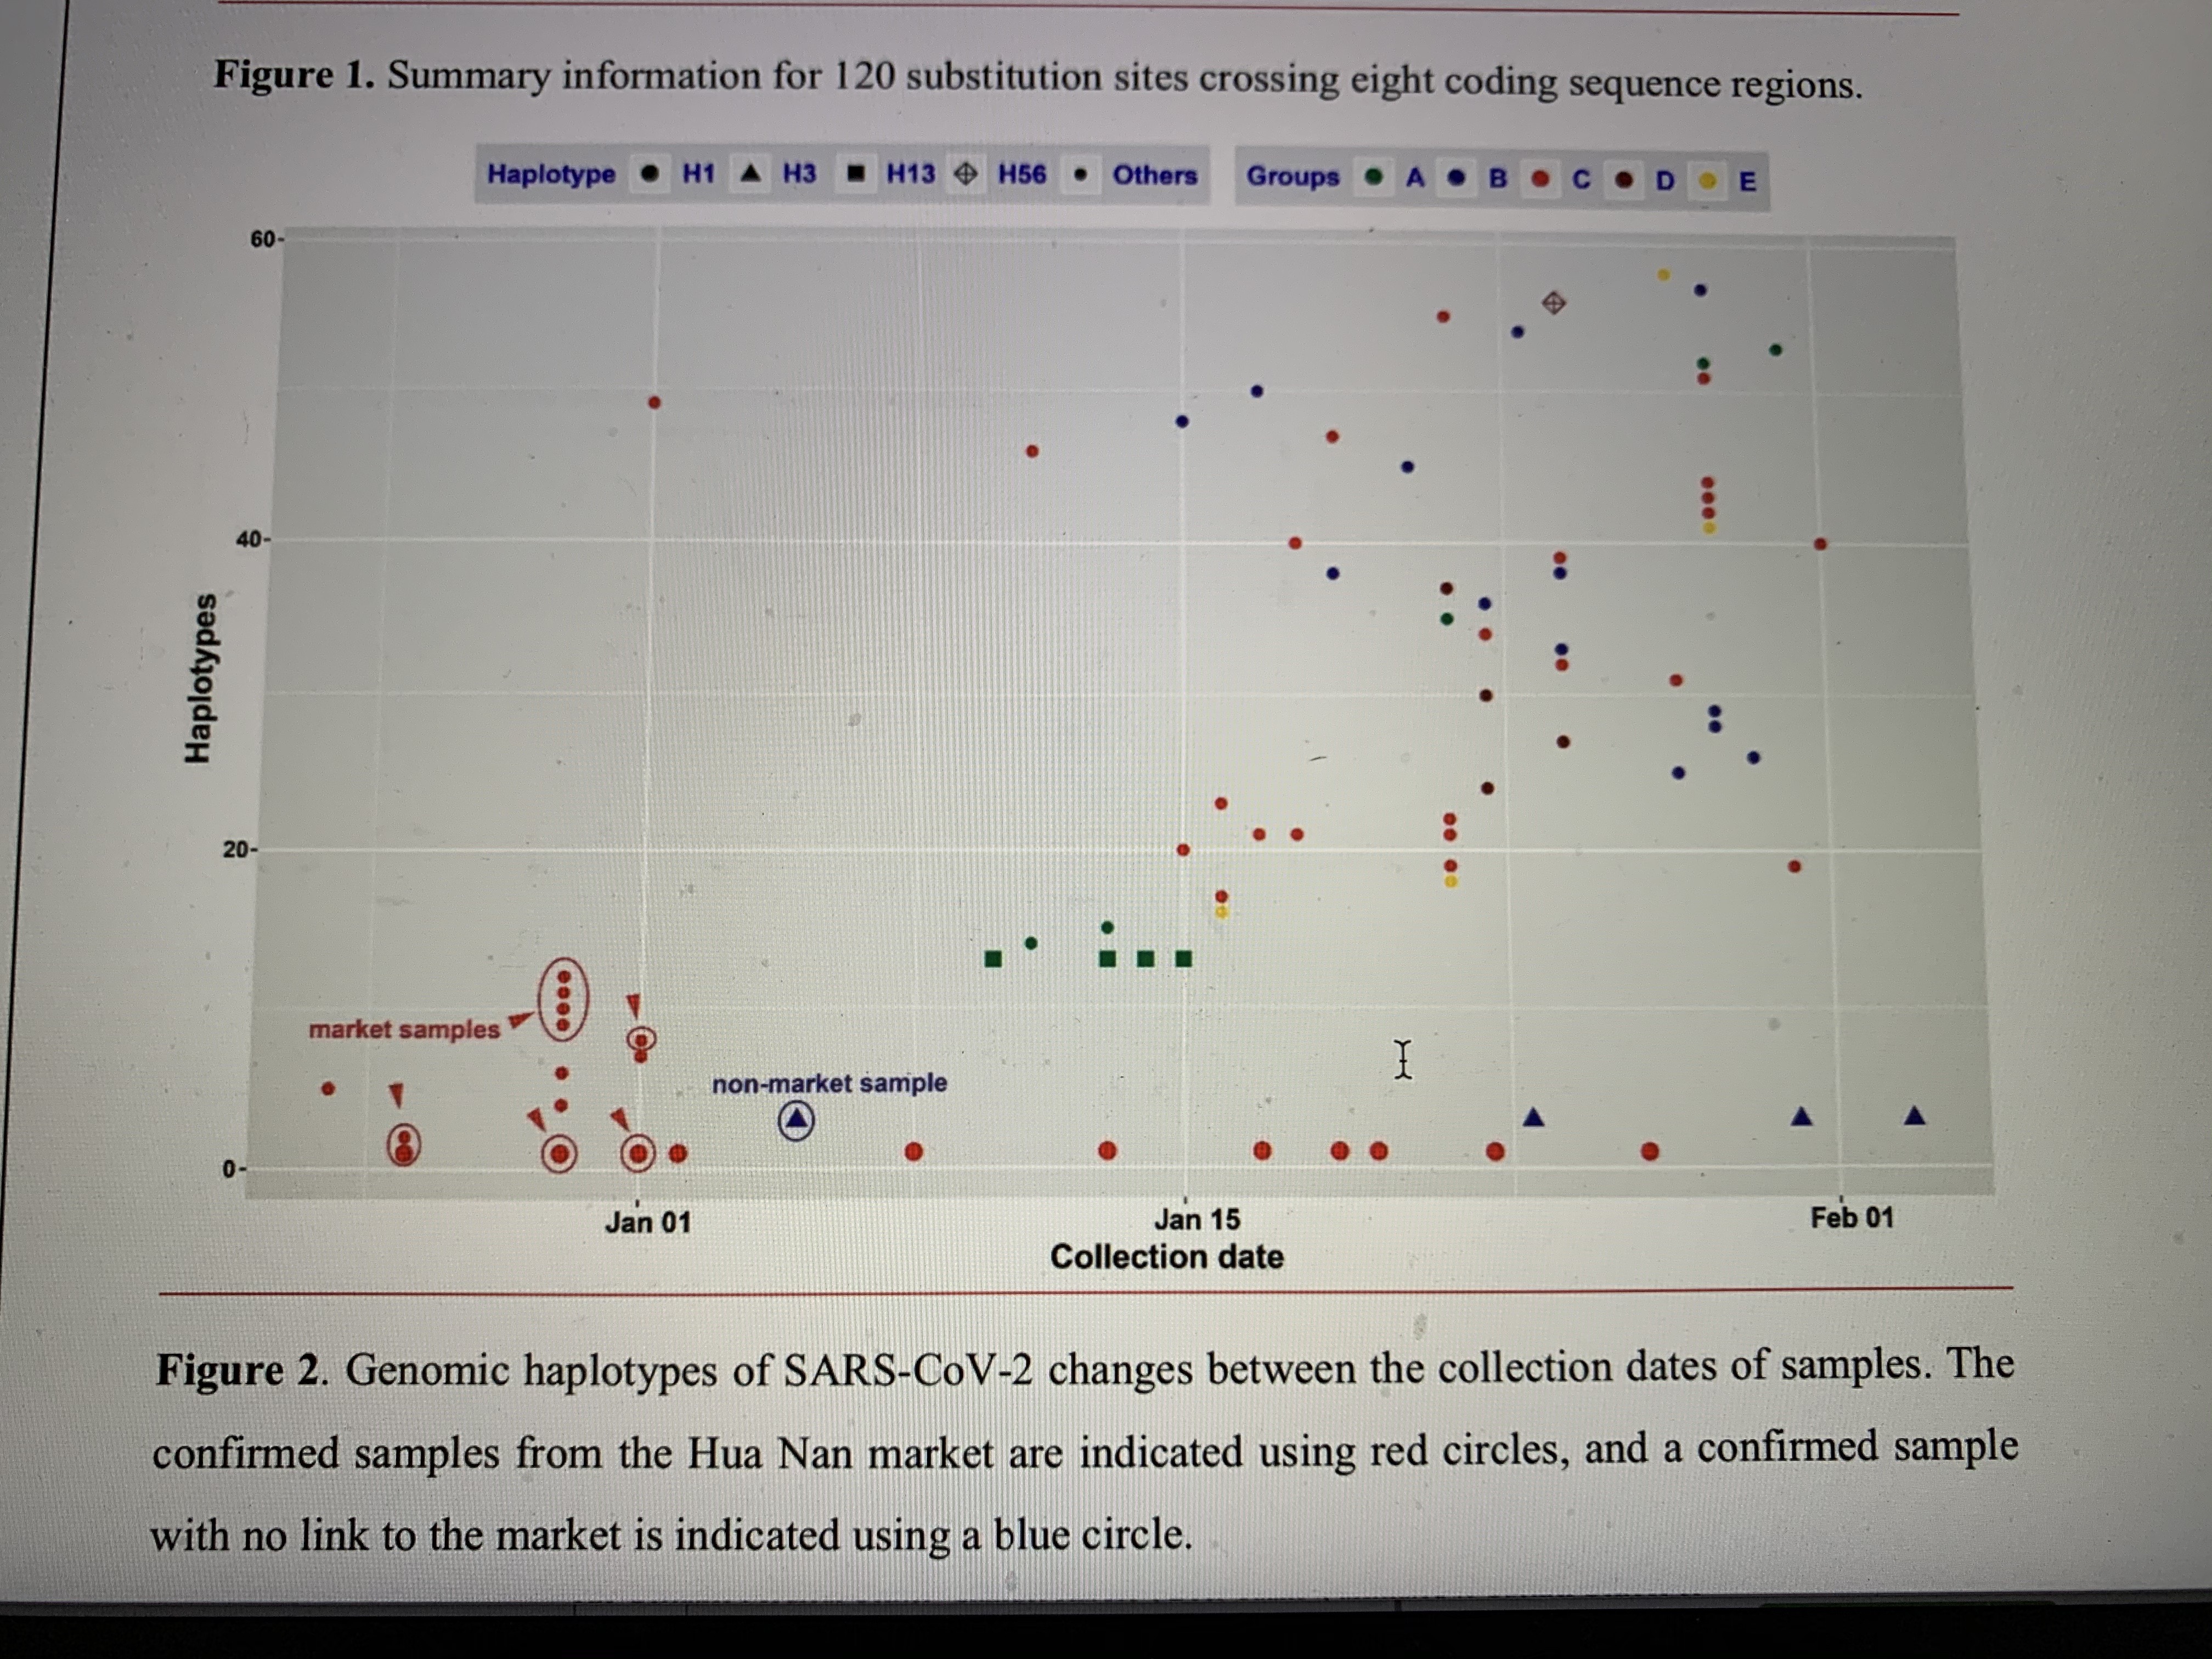
There are 120 substitution sites found in eight coding sequence (CDS) regions, i.e. Replicase polyprotein CDS (75 sites, 0·35% of the whole sequence), Spike glycoprotein CDS (16 sites, 0·42%), ORF3 (7 sites, 0·75%), Membrane glycoprotein CDS (4 sites, 0·60%), ORF7 (3 sites, 0·82%), ORF8 (3 sites, 0·82%), Nucleocapsid protein CDS (11 sites, 0·77%), and ORF10 (1 site, 0.86%), including 79 transitions (65·83%) and 41 transversions (34·17%). A chi-squared test showed that the distribution of substitution sites across ten CDS regions in the genome was even (χ2=1·958, df=9, P=0·99). Substitution sites at the 1st to 3rd frame positions are 27 (25·55%), 44 (40·0%), and 49 (44·55%), respectively. The 120 mutation sites are associated with 119 codons, including 79 non-synonymous (65·83%) and 40 synonymous (33·61%) substitutions. There were 42 non-synonymous substitutions (53·17%) which changed the biochemical properties of the amino acid (AA). The details for each CDS gene are shown in Figure 1 and Table S3. It is not clear whether non-synonymous substitutions and the biochemical property changes of amino acids might change the infectious activities of SARS-CoV-2. The current samplings showed that H1 haplotype has been found in 19 patients, but most haplotypes were just sequenced once. One possible explanation is that a common haplotype from the Hua Nan market (Figure 2, Table S1) was rapidly circulated at an early stage of human-to-human transmissions.
In comparisons with published genomes of SARS-CoV24 and MERS-CoV,25 genomic variations of SARS-CoV-2 are still low, without evident recombination sites/regions (Rm=2, P=1·0) at this time. According to the collection dates of the sequenced samples, haplotypes H1 and H3 were found in two samples at intervals of more than 30 days, and multiple samples over 20 days (Figure 2, Table S1). Although the incubation period can be over 24 days, there was only one case of this out of 1099 observations.26 Estimation of DNA substitution rates using 90 genomes of SARS-CoV-2 showed that the rate for SARS-CoV-2 (0·92×10-3, 95% CI: 0·33-1·46×10-3 substitution/site/year21) was lower than the rates for SARS-CoV (95% CI: 0·80-2·38×10-3 substitution/site/year27) and MERS-CoV (1·12×10-3, 95% CI: 0· ×10-3 substitution/site/year28; ×10-3, 95% CI: 0· ×10-3 substitution/site/year29). It therefore looks as if SARS-CoV-2 is still undergoing stable evolution. Due to mild symptoms and low mortality30,31, the immune system of the infected humans may provide a suitable environment for propagation of SARS-CoV-2. SARS-CoV-2 is highly infectious31 and is able to infect humans not only through the mucous membranes of the nose and mouth, but also use mucous membranes in the eyes,32 which may boost regional circulation and large-scale spread. Some large mutations may have occurred in Wuhan or other regions, but the strict quarantine policy over China since 23 January 2020 may have reduced the circulation and spreading of some mutants.


|
88-1· |
37 |
|
or 0· |
96 |
|
83-1· |
09 |
6
chinaXiv:202002.00033v2
Of 93 genomes of SARS-CoV-2, 39 (41·93%) were from infected patients in 11 countries on four continents and encoded 31 haplotypes (Hd=0·987±0·009 (SD), Pi=0·16×10-3±0·01×10-3), with 27 nationally/regionally private haplotypes. The 54 genomes (58.07%) from China also encoded 31 haplotypes (Hd=0·906±0·001 (SD), Pi=0·14×10-3±0·03×10-3). A proportion Z-test showed significant differences in haplotype diversity of samples between China and other countries (χ2=4·024, df=1, P<0·05). The high haplotype diversity found in samples from other countries may be because the sampling dates were mostly after 22 January 2020, while those in China were before this date (Table S1 and Figure S2). In addition, the low level of radiation exposure on long-distance international flights33 may have accelerated mutation rates of SARS-CoV-2.34
Population size expansion of SARS-CoV-2
Constant population size of SARS-CoV-2 was rejected (Ramos-Onsins and Rozas’s R2=0·025, P<0·001; Raggedness r=0·011, P<0·05) using DnaSP (also see Figure S3), while both Fu’s test (Fs=-67.681.964, P<0·001) and Tajima’s D test (D=-2.701, P<0.001) indicated that the population size of SARS-CoV-2 was rapidly increasing. Mismatch distribution analysis using Arlequin strongly supported that the population of SARS-CoV-2 underwent sudden expansion (τ=2·887, Sum of Squared deviation=0·541×10-3, P=0·88, Harpending’s Raggedness index=0·010, P=0·88). The calculated expansion was 28·72 days (95% CI: 12·29-54·36 days) ago. Of the 93 genomes, the latest one was sampled on 3 February 2020, so the estimated expansion date was on 6 January 2020 (95% CI: 11 December 2019-22 January 2020), when China CDC started to activate a Level-2 emergency response.6 Until 6 January 2020, 129 patients were identified as SARS-CoV-2 infected through field investigations.6 Of 22 genomes (17·05 % of 129 patients) sequenced before 6 January 2020, 13 haplotypes (22.41% of 58 haplotypes) were recovered, which were H1 and its derived descendant haplotypes, and H3 (Figures 2 and 3). The CDS’s emergency response greatly reduced public activities and travels, and may have reduced the local circulation and large-scale spread in the following weeks of January.
Furthermore, mismatch distribution analysis of the 22 genomes before 6 January 2020 also showed a sudden population expansion of SARS-CoV-2 at an earlier stage of transmission (τ=2·818, Sum of Squared deviation=0·010, P=0·41, Harpending’s Raggedness index=0·046, P=0·57, Tajima’s D=-2·241, P<0·001; Fu’s Fs=-7·834, P<0·001). This earlier population expansion time was estimated at 28·38 days (95% CI: 12·00-54·36 days) before 5 January 2020, which was the latest sampling date of the 22 genomes. This earlier expansion was thus estimated to have occurred on 8 December 2019 (95% CI: 13 November 2019-26 December 2019), when there was only one infected patient officially reported.6,11 Therefore, SARS-CoV-2 had already circulated widely among humans in Wuhan before December 2019, probably beginning in mid to late November.21
7
chinaXiv:202002.00033v2
Evolutionary relationships of SARS-CoV-2 haplotypes
The evolutionary network of 58 haplotypes of SARS-CoV-2, with bat-RaTG13-CoV as the outgroup, is shown in Figure 3A. Five main groups can be recognized. In the network, H1, H3, and H13 were three core haplotypes, so Groups A-C were recognized using them as the central (i.e., ancestral super-spreader) haplotypes. Groups D and E were recognized based on two new super-spreader haplotypes, H56 and a medium vector mv2, which was a hypothesized (often ancestral) haplotype not sampled in the current samples. These two groups can be also treated as subgroups of Group C.
In the network, four satellite haplotypes and H35 connected to the H13 haplotype (Group A), and nine satellite haplotypes and H38+H45 and H50 haplotypes connected to H3 (Group B). The evolutionary network showed that bat-RaTG13-CoV connected through a hypothesized haplotype (mv1) to the H13 and H38 haplotypes by single mutations at positions 18,067 (S, synonymous substitution) and 29,102 (S), referring to the alignment length 29,910 bp. The connections between the H3 and H1 haplotypes are two mutations at positions 8,789 (S) and 28,151 (Ns, non-synonymous substitution). The H1 haplotype, the most abundant, included 19 samples, while 26 satellite haplotypes and H40+(H43 and H47) haplotypes are directly derived from the H1 haplotype (Group C). Moreover, five haplotypes of Group D and four haplotypes of Group E should be also derived from the H1 haplotype.
Where are the original sources from?
The evolutionary network suggests that the hypothesized haplotype mv1 may be from an intermediate host or the first infected humans. From those connections, both H13 and H38 would be suggested as ancestral haplotypes. The SH-like approximate likelihood ratio test showed both haplotype H13’s group and H38 (with H45) could be the most basal clades in phylogenies of the 58 haplotypes (Figure S4), but phylogenetic information of the alignment was informative (Figure S5). Two main evolutionary paths of available haplotypes can be from H13 through H3 to H1, or from H38 through H3 to H1 (Figure 3C). Both scenarios demonstrate H3 was the key connection from an ancestral haplotype to H1. Neither H13 nor H38 has samples from Wuhan (Hubei) (Figure 3). H13 was only recovered from five Shenzhen (Guangdong) samples, including the father (patient 2) of the familial cluster, who was one of the first identified infected patients in Guangdong.13 Two derived haplotypes were also only found in Shenzhen (H14 from the grandson of patient 2), and the other three haplotypes were found in three samples from Japan and one sample from Arizona in the United States (Figure 3). According to an epidemiological study, the Shenzhen family traveled to Wuhan after the outbreak was announced, and they could have been infected during their visit in Wuhan from a hospital or an unknown common source13. This suggests that H13 should have originated from Wuhan, but none of the available samples from Wuhan encode haplotypes in Group A. Genetically, haplotypes of Group A have links to only
Wuhan haplotype H3 (only one sample EPI_ISL_406801, with no link to the Hua Nan market). It 8
chinaXiv:202002.00033v2
is possible that H13 was newly derived from H3 in the family from Shenzhen (Figure 3C) and did not spread in Wuhan, or that no samples have been sequenced yet. However, this scenario is not supported by the evolutionary network. H38 has three genomes from the same patient (Table S1), who was the first identified infected patient in the United States.14 He should have been infected while visiting his family in China. The original source of H38 can be explained as that of H13, which is also derived from H3, and the derived H45 was from a Chongqing patient who was working in Wuhan.
The H3 haplotype has only one sample from Wuhan, which was not linked to the Hua Nan market,9 and the other samples in this group were from other countries and regions (Figure 3). Noteworthily, all the samples from the Hua Nan market had the H1 haplotype or its derived haplotypes (H2, H8-H12, see Figure 2 and Table S1), indicating that there were circulated infections within the market in the short term. It is possible that SARS-CoV-2 in the Hua Nan market had been transmitted from other places (Figure 3D), or at least, that Hua Nan market did not host the original source of SARS-CoV-2. As the first identified infected patients had no link to the market,11 it is possible that infected humans transmitted SARS-CoV-2 to workers or sellers in the market, after which it rapidly circulated there. The crowded market boosted SARS-CoV-2 transmissions to buyers and spread it to the whole city in early December 2019, corresponding to the estimated population expansion time.
Regional and worldwide circulation and spread
Of the 54 genomes from patients in China, Chongqing (3 samples), Guangdong (18), Hubei (22), Taiwan (2), and Zhejiang (4) have more than two samples, and the other five provinces sequenced one sample. Hubei (Wuhan) samples from 24 December 2019 to 5 January 2020 encoded 13 haplotypes, belonging to Groups C (H1 and 11 satellite haplotypes) and B (only H3). These relationships indicate a rapid transmission and circulations of SARS-CoV-2 in Wuhan at an early stage of transmission. H1 (no satellite haplotypes) and H3 haplotypes are the ancestors of haplotypes out of Wuhan/Hubei. Eighteen Guangdong samples, collected from 10 to 23 January 2020, encoded 15 haplotypes, belonging to Groups A, C and E, showing that there were multiple sources imported into Guangdong. Three haplotypes (H14, H15 and H17) may have evolved locally, indicating that human-to-human transmissions happened when SARS-CoV-2 initially spread to Shenzhen of Guangdong.13 Two samples from Taiwan encoded H3 and H24 in Groups B and D, respectively, and three samples from Chongqing encoded H1, H40, and H45 in Groups B and C, respectively. There were two sources imported into these two provinces/regions. Four Zhejiang samples encoded H1 and H24 in Group C, which was only imported from the source of the H1 haplotype.
The samples outside of China encoded 31 haplotypes belonging to Groups A-E. Of these, 27
haplotypes are private by regional samplings, only two Thailand samples were the H1 haplotype, 9


chinaXiv:202002.00033v2
one each from Australia and Belgium were the H3 haplotype, one sample from the United States was the H19 haplotype, and one sample from Singapore was the H40 haplotype. Twelve samples, encoding 10 haplotypes, were from patients in five countries in Asia. Seven haplotypes linked to Wuhan and three haplotypes linked to Guangdong (Shenzhen). Human-to-human transmission may have happened from patients with H53 to H52 haplotypes in Tokyo, Japan, who were repatriated Japanese from Wuhan.35 Five Oceanian samples, encoding six haplotypes in Groups B, C, and D, were from patients from three states in Australia, all with links to Wuhan. Patients with H3, with H25 and H26, and with H55 (linked to H1) were directly from Wuhan, and human-to-human transmission was from patients of H25 to H26, who were in a same tour group in Queensland.36 The connection between patients with H56 and H27 is not clear, because the patient with H56 flew to Sydney from Wuhan on 25 January 2020, and the patient with H27 flew to Melbourne from Wuhan on 15 January 2020. One possibility is that there was an intermediary spreader, who also transmitted SARS-CoV-2 to other patients in France, the United States, and Taiwan. Eight European samples, encoding seven haplotypes, were from patients in four countries. Patients in Belgium37 and Germany16 traveled to or stayed in Wuhan. Patients in England did not report a link to Wuhan,38 but a familial transmission was recovered from H28 to H29. Patients in France may have been infected by three different sources, i.e. H44 linked to Wuhan, H43 may link to Chongqing/Singapore, and H30 may link to an intermediary spreader.
Of the 13 genomes from the United States, three were from the same patient in Washington encoding the same haplotype H38, while the other three samples encoded eight haplotypes, covering all five groups (Figure 3A), so the sources of imported infections are complicated. Three haplotypes (H1 (California), H19 (Wisconsin), and H38 (Washington)) were linked to Wuhan, and three (H19 (Wisconsin), H35 (Arizona), H42 (California)) to five (H41 (California) and H58 (Illinois)) haplotypes may link to Guangdong. The remaining haplotypes (H36 (California), H37 (California), and H57 (Massachusetts)) linked to patients out of China (H54 (Vietnam) and H56 (Australia)), who were from Wuhan.15,39 It is not clear where they were infected. There is no human-to-human transmission evidence in the United States from the 11 cases.
Phylogenetic approaches provide insight into the epidemiology of SARS-CoV-2
Epidemiological study of SARS-CoV-2 using traditional approaches is very difficult, because it was not identified as a new coronavirus until 29 December, and some infected people with mild symptoms or without symptoms16,40 may have been overlooked in late November and early December. Moreover, the Hua Nan market, which was considered as the birthplace of SARS-CoV-2, has been closed since 1 January 2020. In this study, we have used genomic data for SARS-CoV-2 to infer evolutionary relationships of the 58 haplotypes, and to suggest that H1 and its descendant haplotypes from the Hua Nan market should be derived from the H3 haplotype, which was not linked to the market (Figure 3C). This suggests that the source of the coronavirus in
the Hua Nan market was imported from elsewhere, as also suggested by other researchers.12 The 10
chinaXiv:202002.00033v2
phylogenetic network indicated that H13 and H38 should be ancestral haplotypes that connected to the outgroup bat-RaTG13-CoV through a hypothesized intermediate haplotype. Because the currently available samples do not include the first identified infected patient and other patients from early December, the most common ancestral haplotype might be missed. If there are any frozen samples from those patients, it would be worth doing genomic sequencing for phyloepidemiologic study to help to locate the birthplace of SARS-CoV-2 in Wuhan. Meanwhile, we expect that the H13 and H38 haplotypes will be found in some samples of infected patients in Wuhan if more samples are sequenced in future. This will be very important in the search for the original sources of SARS-CoV-2, because both H13 and H38 tend to be ancestral haplotypes.
The evolutionary network of haplotypes can be used to recover the directions of human-to-human transmissions at the local scale and spread at the larger scale. The central haplotype can be considered as the super-spreader haplotype, and the tip haplotype is the most recent descendant haplotype. The transmission direction can be identified using the connection information of tips and branches. For example, the confirmed patients from the Hua Nan market shared the common ancestral haplotype H1, indicating they were infected from a common source, who may have been a super-spreader in the market. This transmission phenomenon may also have happened in Shenzhen with the patients of Group A. This approach has recovered specific directions of human-to-human transmission in the Shenzhen family (H13 → H14), the Queensland tour group (H25 → H26), the England family (H28 → H29), and the repatriated Japanese from Wuhan (H53 → H52). Most international infections link to Wuhan directly or indirectly, but for some of them it is not clear exactly where they were infected. As discussed above, we have found that some patients in Japan and United States might have been infected in Guangzhou, and one patient in France might have been infected in Chongqing or Singapore. We suspect that super-spreaders mediate the spreading from China to worldwide. At least, the infected people with H56 and mv2, as well as H54, contributed at least three haplotypes (Figure 3A).
Contributors
W-BY conceived the research, analyzed the data, interpreted the results, and wrote the draft manuscript; WBY and GDT collected data; all authors reviewed and approved the final version of the manuscript.
Declaration of interests
We declare no competing interests.
Acknowledgements
We are grateful to scientists and researchers for depositing whole genomic sequences of Novel Pneumonia Coronavirus (SARS-CoV-2) at the Global Initiative on Sharing All Influenza Data (GISAID) EpiFluTM; to GISAID database for allowing us to access the sequences for
11
chinaXiv:202002.00033v2
non-commercial scientific research; and to Dr. Jin Chen and Dr. De-Zhu Li for their valuable comments and suggestions on conceiving the research and an early version of the manuscript. WBY also thanks his wife Dr. Nan Jiang for supporting him in daily life during the quarantine of the Novel Pneumonia outbreak, so he can focus on this research. This study was supported by grants from the Strategic Priority Research Program of the Chinese Academy of Sciences (XDB31000000), Ten Thousand Talents Program of Yunnan for Top‐notch Young Talents, and the open research project of “Cross-Cooperative Team” of the Germplasm Bank of Wild Species, Kunming Institute of Botany, Chinese Academy of Sciences.
References
1. Cui J, Li F, Shi Z-L. Origin and evolution of pathogenic coronaviruses. Nat Rev Microbiol 2019; 17(3): 181-92.
2. Gorbalenya AE, Baker SC, Baric RS, et al. Severe acute respiratory syndrome-related coronavirus: The species and its viruses – a statement of the Coronavirus Study Group. 2020: 2020.02.07.937862.
3. Zhou P, Yang X-L, Wang X-G, et al. A pneumonia outbreak associated with a new coronavirus of probable bat origin. Nature 2020; doi: 10.1038/s41586-020-2012-7.
4. Zhu N, Zhang D, Wang W, et al. A novel coronavirus from patients with pneumonia in China, 2019. N Engl J Med 2020: 10.1056/NEJMoa2001017.
5. A live infection database of the 2019-nCoV outbreak 2020. http://fms.news.cn/swf/2020_sjxw/2_1_xgyq/index.html (accessed Feb 8 2020).
6. Li Q, Guan X, Wu P, et al. Early transmission dynamics in Wuhan, China, of novel coronavirus–infected pneumonia. N Engl J Med 2020: 10.1056/NEJMoa2001316.
7. Wu JT, Leung K, Leung GM. Nowcasting and forecasting the potential domestic and international spread of the 2019-nCoV outbreak originating in Wuhan, China: a modelling study. Lancet 2020: 10.1016/S0140-6736(20)30260-9.
- Chan-Yeung M, Xu R-H. SARS: epidemiology. Respirology 2003; 8(s1): S9-S14.
- Lu R, Zhao X, Li J, et al. Genomic characterisation and epidemiology of 2019 novel
coronavirus: implications for virus origins and receptor binding. Lancet 2020: 10.1016/S0140-6736(20)30251-8.
10. Lam TT-Y, Shum MH-H, Zhu H-C, et al. Identification of 2019-nCoV related coronaviruses in Malayan pangolins in southern China. 2020: 2020.02.13.945485.
11. Huang C, Wang Y, Li X, et al. Clinical features of patients infected with 2019 novel coronavirus in Wuhan, China. Lancet 2020: 10.1016/S0140-6736(20)30183-5.
12. Cohen J. Wuhan seafood market may not be source of novel virus spreading globally. Science 2020: 10.1126/science.abb0611.
13. Chan JF-W, Yuan S, Kok K-H, et al. A familial cluster of pneumonia associated with the 2019 novel coronavirus indicating person-to-person transmission: a study of a family cluster. Lancet 2020: 10.1016/S0140-6736(20)30154-9.
12
chinaXiv:202002.00033v2
14. Holshue ML, DeBolt C, Lindquist S, et al. First Case of 2019 Novel Coronavirus in the United States. N Engl J Med 2020: 10.1056/NEJMoa2001191.
15. Phan LT, Nguyen TV, Luong QC, et al. Importation and human-to-human transmission of a novel coronavirus in Vietnam. N Engl J Med 2020: 10.1056/NEJMc2001272.
16. Rothe C, Schunk M, Sothmann P, et al. Transmission of 2019-nCoV infection from an asymptomatic contact in Germany. N Engl J Med 2020: 10.1056/NEJMc2001468.
17. Shu Y, McCauley J. GISAID: Global initiative on sharing all influenza data – from vision to reality. Euro Surveill 2017; 22(13): 30494.
18. Katoh K, Standley DM. MAFFT multiple sequence alignment software version 7: improvements in performance and usability. Mol Biol Evol 2013; 30(4): 772-80.
19. Rozas J, Ferrer-Mata A, Sánchez-DelBarrio JC, et al. DnaSP 6: DNA sequence polymorphism analysis of large data sets. Mol Biol Evol 2017; 34(12): 3299-302.
20. Excoffier L, Lischer HEL. Arlequin suite ver 3.5: a new series of programs to perform population genetics analyses under Linux and Windows. Mol Ecol Resour 2010; 10(3): 564-7.
21. Rambaut A. Phylodynamic analysis | 90 genomes | 12 Feb 2020. 2020. http://virological.org/t/phylodynamic-analysis-90-genomes-12-feb-2020/356 (accessed Feb 12 2020).
22. Bandelt HJ, Forster P, Röhl A. Median-joining networks for inferring intraspecific phylogenies. Mol Biol Evol 1999; 16(1): 37-48.
23. Minh BQ, Schmidt HA, Chernomor O, et al. IQ-TREE 2: New models and efficient methods for phylogenetic inference in the genomic era. Mol Biol Evol 2020.
24. Luk HKH, Li X, Fung J, Lau SKP, Woo PCY. Molecular epidemiology, evolution and phylogeny of SARS coronavirus. Infect Genet Evol 2019; 71: 21-30.
25. Cotten M, Watson SJ, Kellam P, et al. Transmission and evolution of the Middle East respiratory syndrome coronavirus in Saudi Arabia: a descriptive genomic study. Lancet 2013; 382(9909): 1993-2002.
26. Guan W-j, Ni Z-y, Hu Y, et al. Clinical characteristics of 2019 novel coronavirus infection in China. medRxiv 2020: 2020.02.06.20020974.
27. Zhao Z, Li H, Wu X, et al. Moderate mutation rate in the SARS coronavirus genome and its implications. BMC Evol Biol 2004; 4: 21.
28. Cotten M, Watson SJ, Zumla AI, et al. Spread, circulation, and evolution of the middle rast tespiratory syndrome Coronavirus. mBio 2014; 5(1): e01062-13.
29. Dudas G, Carvalho LM, Rambaut A, Bedford T. MERS-CoV spillover at the camel-human interface. 2018; 7: e31257.
30. Zhang R, Liu H, Li F, et al. Transmission and epidemiological characteristics of Novel Coronavirus (2019-nCoV) Pneumonia (NCP): preliminary evidence obtained in comparison with 2003-SARS. medRxiv 2020: 2020.01.30.20019836.
31. Yang Y, Lu Q, Liu M, et al. Epidemiological and clinical features of the 2019 novel
coronavirus outbreak in China. medRxiv 2020: 2020.02.10.20021675. 13
chinaXiv:202002.00033v2
32. Lu C-w, Liu X-f, Jia Z-f. 2019-nCoV transmission through the ocular surface must not be ignored. Lancet 2020: 10.1016/S0140-6736(20)30313-5.
33. Bottollier-Depois J-F, Chau Q, Bouisset P, Kerlau G, Plawinski L, Lebaron-Jacobs L. Assessing exposure to cosmic radiation during long-haul flights. Radiat Res 2000; 153(5): 526-32, 7.
34. Shibai A, Takahashi Y, Ishizawa Y, et al. Mutation accumulation under UV radiation in Escherichia coli. Sci Rep 2017; 7(1): 14531.
35. Japan tightens immigration as 3 more infected by coronavirus. 2020. http://www.asahi.com/ajw/articles/AJ202002020013.html (accessed 2 February 2020).
36. Coronavirus outbreak: Second case confirmed in Queensland. 2020. https://7news.com.au/lifestyle/health-wellbeing/qld-coronavirus-case-remains-in-isolation-c-6715 00.
37. Belgium: First case of coronavirus confirmed in Belgium February 3. 2020. https://www.garda.com/fr/crisis24/alertes-de-securite/311116/belgium-first-case-of-coronavirus-co nfirmed-in-belgium-february-3 (accessed 4 February 2020).
38. UK confirms first new coronavirus case; rises risk level. 2020. https://www.pharmaceutical-technology.com/news/uk-coronavirus-case/ (accessed 31 January 2020).
39. Fifth Australian coronavirus case confirmed as 21-year-old UNSW student. 2020. https://www.sbs.com.au/news/fifth-australian-coronavirus-case-confirmed-as-21-year-old-unsw-st udent (accessed 27 January 2020).
40. Heymann DL, Shindo N. COVID-19: what is next for public health? Lancet 2020: 10.1016/S0140-6736(20)30374-3.

One Response to Decoding the evolution and transmissions of the novel pneumonia coronavirus (SARS-CoV-2) using whole genomic data