The Big Cycles Over The Last 500 Years

by Ray Dalio 
NEWSLETTER ON LINKEDIN Principled Perspectives  By Ray DalioThe Big Cycles Over The Last 500 YearsNote: To make this an easier and shorter article to read, I tried to convey the most important points in simple language and bolded them, so you can get the gist of the whole thing in just a few minutes by focusing on what’s in bold. Past chapters from the series can be found here: IntroductionChapter 1 and Chapter 2. Additionally, if you want a simple and entertaining 30-minute explanation of how what a lot of what I’m talking about here works, see “How the Economic Machine Works,” which is available on YouTube.In Chapter 1 (“The Big Picture in a Tiny Nutshell”), I looked at the archetypical rises and declines of empires and their reserve currencies and the various types of powers that they gained and lost, and in Chapter 2 (“The Big Cycle of Money, Credit, Debt, and Economic Activity”) and its appendix (“The Changing Value of Money”) I reviewed the big money, credit, and debt cycles.  In this chapter, I will review the rises and declines of the Dutch, British, and American empires and their reserve currencies and will touch on the rise of the Chinese empire. While the evolution of empires and currencies is one continuous story that started before there was recorded history, in this chapter I am going to pick up the story around the year 1600.  My objective is simply to put where we are in perspective of history and bring us up to date.  I will begin by very briefly reviewing what the Big Cycle looks like and then scan through the last 500 years to show these Big Cycles playing out before examining more closely the declines of the Dutch and British empires and their reserve currencies.  Then I will show how the decline of the British empire and the pound evolved into the rise of the US empire and US dollar and I will take a glimpse at the emergence of the Chinese empire and the Chinese renminbi.That will bring us up to the present and prepare us to try to think about what will come next.  The Big Cycle of the Life of an EmpireJust as there is a human life cycle that typically lasts about 80 years (give or take) and no two are exactly the same but most are similar, there is an analogous empire life cycle that has its own typical patterns.  For example, for most of us, during the first phase of life we are under our parents’ guidance and learn in school until we are about 18-24, at which point we enter the second phase.  In this phase we work, become parents, and take care of others who are trying to be successful.  We do this until we are about 55-65, at which time we enter the third phase when we become free of obligations and eventually die.  It is pretty easy to tell what phases people are in because of obvious markers, and it is sensible for them to know what stages they are in and to behave appropriately in dealing with themselves and with others based on that.  The same thing is true for countries.  The major phases are shown on this chart.  It’s the ultra-simplified archetypical Big Cycle that I shared in the last chapter. No alt text provided for this image
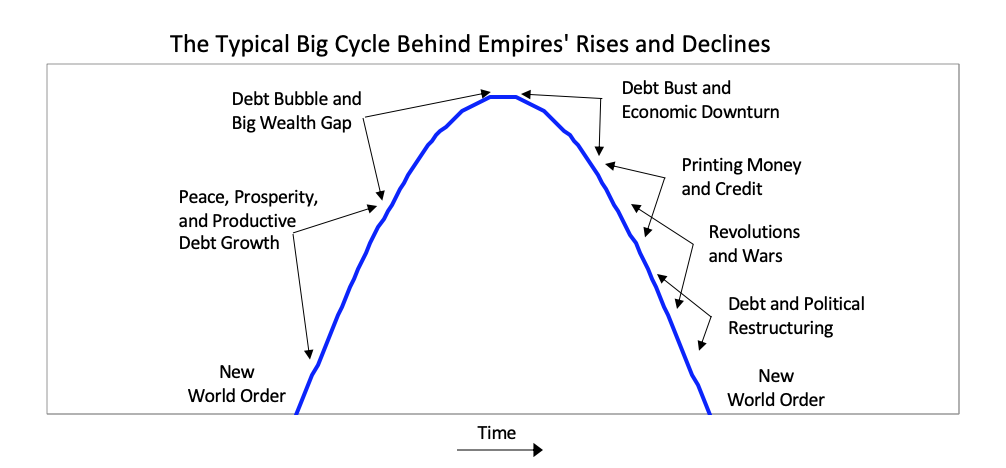
In brief, after the creation of a new set of rules establishes the new world order, there is typically a peaceful and prosperous period.  As people get used to this they increasingly bet on the prosperity continuing, and they increasingly borrow money to do that, which eventually leads to a bubble.  As the prosperity increases the wealth gap grows.  Eventually the debt bubble bursts, which leads to the printing of money and credit and increased internal conflict, which leads to some sort of wealth redistribution revolution that can be peaceful or violent.  Typically at that time late in the cycle the leading empire that won the last economic and geopolitical war is less powerful relative to rival powers that prospered during the prosperous period, and with the bad economic conditions and the disagreements between powers there is typically some kind of war.  Out of these debt, economic, domestic, and world-order breakdowns that take the forms of revolutions and wars come new winners and losers.  Then the winners get together to create the new domestic and world orders.  That is what has repeatedly happened through time.  The lines in the chart signify the relative powers of the 11 most powerful empires over the last 500 years.  In the chart below you can see where the US and China are currently in their cycles.  As you can see the United States is now the most powerful empire by not much, it is in relative decline, Chinese power is rapidly rising, and no other powers come close.  No alt text provided for this image
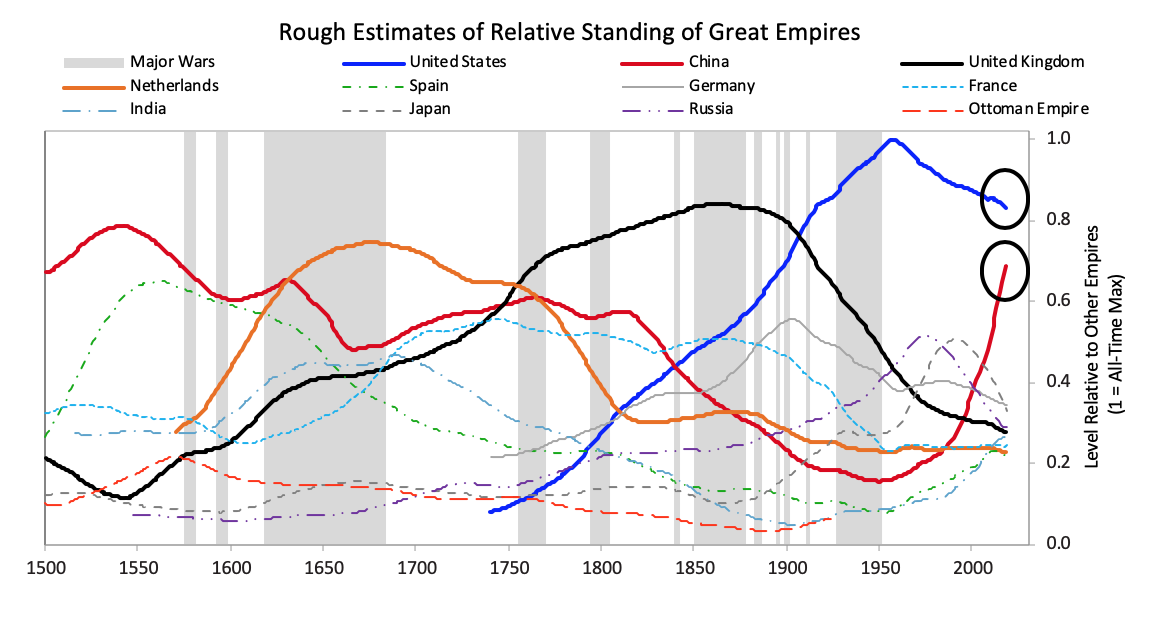
Because that chart is a bit confusing, for simplicity the next chart shows the same lines as in that chart except for just the most powerful reserve currency empires (which are based on an average of eight different measures of power that we explained in Chapter 1 and will explore more carefully in this chapter).No alt text provided for this image
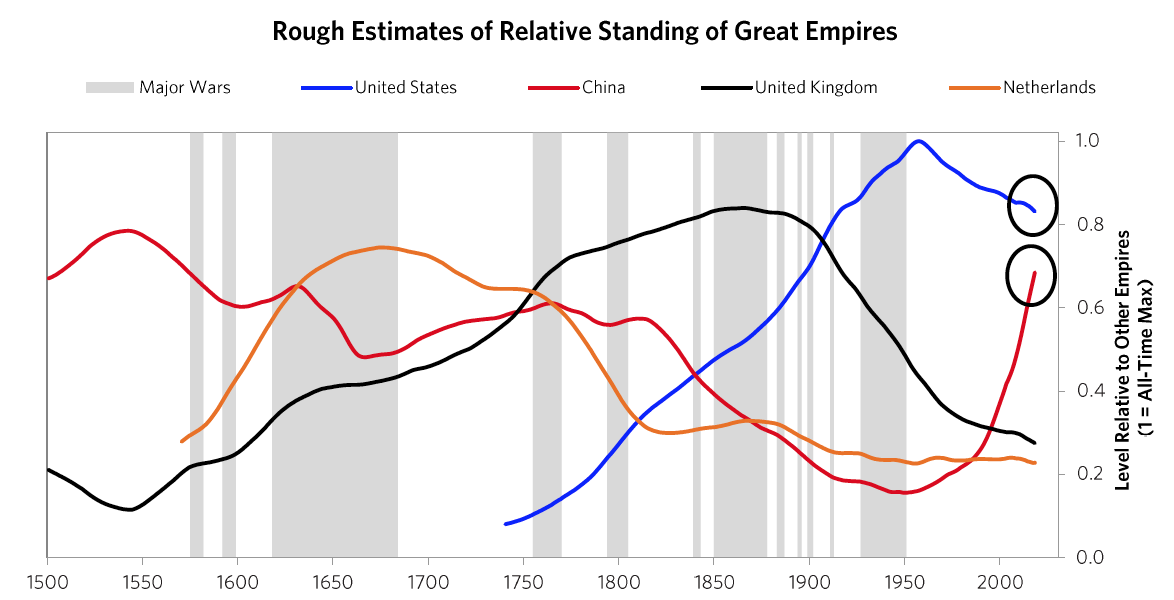
The next chart offers an even more simplified view.  As shown, the United States and China are the only two major powers, you can see where each of their Big Cycles is, and you can see that they are approaching comparability, which is when the risks of wars of one type or another are greater than when the leading powers are earlier in the cycle.  To be clear, I didn’t start out trying to make an argument and then go looking for stats to support it; doing that doesn’t work in my profession as only accuracy pays.  I simply gathered stats that reflected these different measures of strength and put them in these indices, which led to these results.  I suspect that if you did that exercise yourself picking whatever stats you’d like you’d see a similar picture, and I suspect that what I’m showing you here rings true to you if you’re paying attention to such things. For those reasons I suspect that all I am doing is helping you put where we are in perspective.  To reiterate, I am not saying anything about the future.  I will do that in the concluding chapter of this book.  All I want to do is bring you up to date and, in the process, make clear how these cycles have worked in the past, which will also alert you to the markers to watch out for and help you see where in the cycles the major countries are and what is likely to come next.No alt text provided for this image
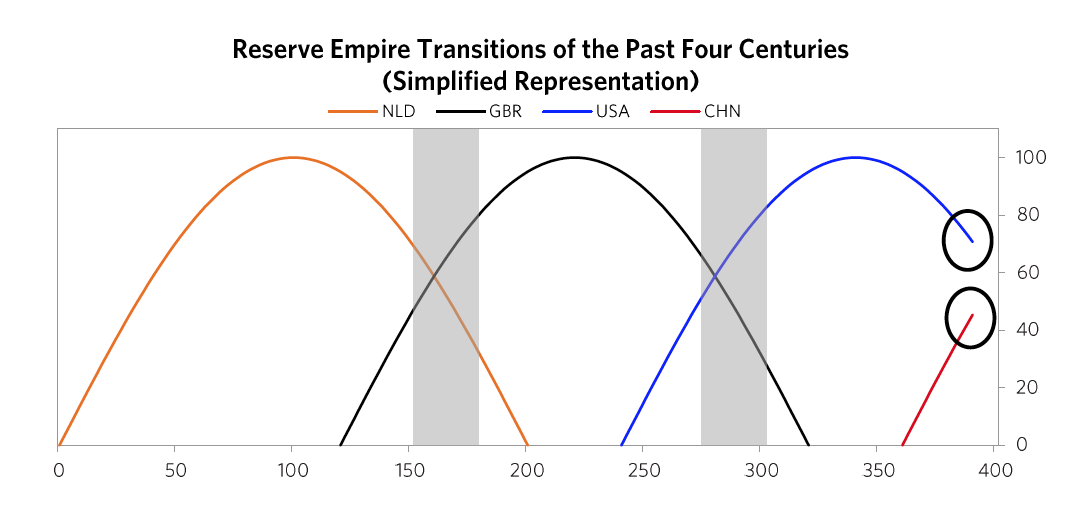
The chart below from Chapter 1 shows this play out via the eight measures of strength—education, innovation and technology, competitiveness, military, trade, output, financial center, and reserve status—that we capture in the aggregate charts.  It shows the average of each of these measures of strength, with most of the weight on the most recent three reserve countries (the US, the UK, and the Dutch).[1]  No alt text provided for this image
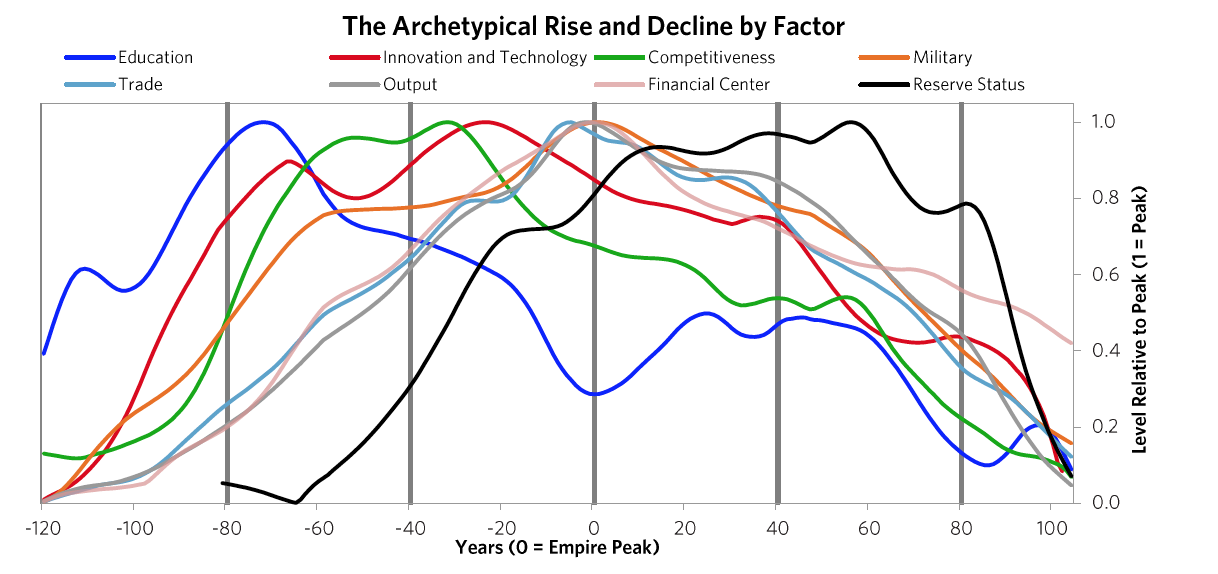
As explained in Chapter 1, in brief these strengths and weaknesses are mutually reinforcing—i.e., strengths and weaknesses in education, competitiveness, economic output, share of world trade, etc., contribute to the others being strong or weak, for logical reasons—and their order is broadly indicative of the processes that lead to the rising and declining of empires.  For example, quality of education has been the long-leading strength of rises and declines in these measures of power, and the long-lagging strength has been the reserve currency.  That is because strong education leads to strengths in most areas, including the creation of the world’s most common currency.  That common currency, just like the world’s common language, tends to stay around because the habit of usage lasts longer than the strengths that made it so commonly used.     We will now look at the specifics more closely, starting with how these Big Cycles have played out over the last 500 years and then looking at the declines of the Dutch and British empires so you can see how these things go.1)    The Last 500 Years in About 4,000 Words The Rise & Decline of the Dutch Empire and the Dutch Guilder In the 1500-1600 period the Spanish empire was the pre-eminent economic empire in the “Western” world while the Chinese empire under the Ming Dynasty was the most powerful empire in the “Eastern” world, even more powerful than the Spanish empire (see the green dashed line and the red solid line in chart 2).  The Spanish got rich by taking their ships and military power around the world, seizing control of vast areas (13% of the landmass of the earth!) and extracting valuable things from them, most importantly gold and silver which were the money of the time.  As shown by the orange line in the chart of the relative standing of the great empires, the Dutch gained power as Spanish power was waning.  At the time Spain controlled the small area we now call Holland.  When the Dutch became powerful enough in 1581, they overthrew the Spanish and went on to eclipse both the Spanish and the Chinese as the world’s richest empire from around 1625 to their collapse in 1780.  The Dutch empire reached its peak around 1650 in what was called the Dutch Golden Age.  This period was one of great globalization as ships that could travel around the world to gain the riches that were out there flourished, and the Dutch, with their great shipbuilding and their economic system, were ahead of others in using ships, economic rewards, and military power to build their empire.  Holland (as we now call it) remained the richest power for about 100 years.  How did that happen?The Dutch were superbly educated people who were very inventive—in fact they came up with 25% of all major inventions in the world at their peak in the 17th century.  The two most important inventions they came up with were 1) ships that were uniquely good that could take them all around the world, which, with the military skills that they acquired from all the fighting they did in Europe, allowed them to collect great riches around the world, and 2) the capitalism that fueled these endeavors.  Not only did the Dutch follow a capitalist approach to resource allocation, they invented capitalism.  By capitalism I mean public debt and equity markets.  Of course production existed before, but that is not capitalism, and of course trade existed before, but that is not capitalism, and of course private ownership existed before, but that is not capitalism.  By capitalism I mean the ability of large numbers of people to collectively lend money and buy ownership in money-making endeavors.  The Dutch created that when they invented the first listed public company (the Dutch East India Company) and the first stock exchange in 1602 and when they built the first well-developed lending system in which debt could more easily be created.  They also created the world’s first reserve currency.  The Dutch guilder was the first “world reserve currency” other than gold and silver because it was the first empire to extend around much of the world and to have its currency so broadly accepted.  Fueled by these qualities and strengths, the Dutch empire continued to rise on a relative basis until around 1700 when the British started to grow strongly.  The numerous investment market innovations of the Dutch and their successes in producing profits attracted investors, which led to Amsterdam becoming the world’s leading financial center; the Dutch government channeled money into debt and some equity investments in various businesses, the most important of which was the Dutch East India Company.At this time of prosperity, other countries grew in power too.  As other countries became more competitive, the Dutch empire became more costly and less competitive, and it found maintaining its empire less profitable and more challenging.  Most importantly the British got stronger economically and militarily in the classic ways laid out in Chapter 1.  Before they had become clear competitors they had military partnerships during most of the 80+ years leading up to the Fourth Anglo-Dutch War.  That changed over time as they bumped into each other in the same markets.  The Dutch and British had lots of conflicts over economic issues.  For example, the English made a law that only English ships could be used to import goods into England, which hurt Dutch shipping companies that had a big business of shipping others’ goods to England, which led to the English seizing Dutch ships and expanding the British East India Company.  Typically before all-out war is declared there is about a decade of these sorts of economic, technological, geopolitical, and capital wars when the conflicting powers approach comparability and test and try to intimidate each other’s powers.  At the time the British came up with military inventions and built more naval strength, and they continued to gain relative economic strength.   As shown in the chart of relative standing of empires shown above, around 1750 the British became a stronger power than the Dutch, particularly economically and militarily, both because the British (and French) became stronger and because the Dutch became weaker.  As is classic the Dutch a) became more indebted, b) had a lot of internal fighting over wealth (between its states/provinces, between the rich and the poor, and between political factions)[2], and c) had a weakened military—so the Dutch were weak and divided, which made them vulnerable to attack.As is typical, the rising great power challenged the existing leading power in a war to test them both economically and militarily.  The English hurt the Dutch economically by hurting their shipping business with other countries.  The British attacked the Dutch.  Other competing countries, most importantly France, took this as an opportunity to grab shipping business from the Dutch.  That war, known as the Fourth Anglo-Dutch War, lasted from 1780 to 1784.  The British won it handily both financially and militarily.  That bankrupted the Dutch and caused Dutch debt and equities, the Dutch guilder, and the Dutch empire to collapse.  In the next section we will look at that collapse up close.  At that time, in the late 18th century, there was a lot of fighting between countries with various shifting alliances within Europe.  While similar fights existed around the world as they nearly always do, the only reason I’m focusing on these fights is because I’m focusing just on the leading powers and these were the leading two.  After the British defeated the Dutch, Great Britain and its allies (Austria, Prussia, and Russia) continued to fight the French led by Napoleon in the Napoleonic Wars.  Finally, after around a quarter-century of frequent fighting since the start of the French Revolution, the British and its allies won in 1815.  The Rise & Decline of the British Empire and the British PoundAs is typical after wars, the winning powers (most notably the UK, Russia, Austria, and Prussia) met to agree on the new world order. That meeting was called the Congress of Vienna.  In it the winning powers re-engineered the debt, monetary, and geopolitical systems and created a new beginning as laid out in the Treaty of Paris.  That set the stage for Great Britain’s 100-year-long “imperial century” during which Great Britain became the unrivaled world power, the British pound became the world’s dominant currency, and the world flourished.  As is typical, following the period of war there was an extended period—in this case 100 years—of peace and prosperity because no country wanted to challenge the dominant world power and overturn the world order that was working so well.  Of course during these 100 years of great prosperity there were bad economic periods along the lines of what we call recessions and which used to be called panics (e.g., the Panic of 1825 in the UK, or the Panics of 1837 and 1873 in the US) and there were military conflicts (e.g., the Crimean War between Russia on one side and the Ottoman empire with a coalition of Western European powers as allies on the other), but they were not significant enough to change the big picture of this being a very prosperous and peaceful period with the British on top.  Like the Dutch before them, the British followed a capitalist system to incentivize and finance people to work collectively, and they combined these commercial operations with military strength to exploit global opportunities in order to become extremely wealthy and powerful.  For example the British East India Company replaced the Dutch East India Company as the world’s most economically dominant company and the company’s military force became about twice the size of the British government’s standing military force.  That approach made the British East India Company extremely powerful and the British people very rich and powerful.  Additionally, at the same time, around 1760, the British created a whole new way of making things and becoming rich while raising people’s living standards.  It was called the Industrial Revolution.  It was through machine production, particularly propelled by the steam engine.  So, this relatively small country of well-educated people became the world’s most powerful country by combining inventiveness, capitalism, great ships and other technologies that allowed them to go global, and a great military to create the British empire that was dominant for the next 100 years.  Naturally London replaced Amsterdam as the world’s capital markets center and continued to innovate financial products. Later in that 100-year peaceful and prosperous period, from 1870 to the early 1900s the inventive and prosperous boom continued as the Second Industrial Revolution.  During it human ingenuity created enormous technological advances that raised living standards and made those who developed them and owned them rich. This period was for Great Britain what “the Dutch Golden Age” was for the Dutch about 200 years earlier because it raised the power in all the eight key ways—via excellent education, new inventions and technologies, stronger competitiveness, higher output and trade, a stronger military and financial center, and a more widely used reserve currency.At this time several other countries used this period of relative peace and prosperity to get richer and stronger by colonizing enormous swaths of the world.  As is typical during this phase, other countries copied Britain’s technologies and techniques and flourished themselves, producing prosperity and, with it, great wealth gaps.  For example, during this period there was the invention of steel production, the development of the automobile, and the development of electricity and its applications such as for communications including Alexander Graham Bell’s telephone and Thomas Edison’s incandescent light bulb and phonograph.  This is when the United States grew strongly to become a leading world power.  These countries became very rich and their wealth gaps increased.  That period was called “the Gilded Age” in the US, “la Belle Époque” in France, and “the Victorian Era” in England.  As is typical at such times the leading power, Great Britain, became more indulgent while its relative power declined, and it started to borrow excessively.As other countries became more competitive, the British empire became more costly and less profitable to maintain.  Most importantly other European countries and the US got stronger economically and militarily in the classic ways laid out in Chapter 1.  As shown in the chart of the standing of empires above, the US became a comparable power economically and militarily around 1900 though the UK retained stronger military power, trade, and reserve currency status, and the US continued to gain relative strength from there.From 1900 until 1914, as a consequence of the large wealth gaps, there became 1) greater arguments about how wealth should be divided within countries and 2) greater conflicts and comparabilities in economic and military powers that existed between European countries.  As is typical at such times the international conflicts led to alliances being formed and eventually led to war.  Before the war the conflicts and the alliances were built around money and power considerations.  For example, typical of conflicting powers that seek to cut off their enemies’ access to money and credit, Germany under Bismarck refused to let Russia sell its bonds in Berlin, which led them to be sold in Paris, which reinforced the French-Russian alliance.  The wealth gap in Russia led it to tumble into revolution in 1917 and out of the war, which is a whole other dramatic story about fighting over wealth and power that is examined in Part 2 of this book.  Similar to the economically motivated shipping conflict between the British and the Dutch, Germany sank five merchant ships that were going to England in the first years of the war.  That brought the United States into the war.  Frankly, the complexities of the situations leading up to World War I are mind-boggling, widely debated among historians, and way beyond me. That war, which was really the first world war because it involved countries all around the world because the world had become global, lasted from 1914 until 1918 and cost the lives of an estimated 8.5 million soldiers and 13 million civilians.  As it ended, the Spanish flu arrived, killing an estimated 20-50 million people over two years.  So 1914-20 was a terrible time. The Rise of the American Empire and the US Dollar After World War I[3]As is typical after wars, the winning powers—in this case the US, Britain, France, Japan, and Italy—met to set out the new world order. That meeting, called the Paris Peace Conference, took place in early 1919, lasted for six months, and concluded with the Treaty of Versailles.  In that treaty the territories of the losing powers (Germany, Austria-Hungary, the Ottoman empire, and Bulgaria) were carved up and put under the controls of the winning empires and the losing powers were put deeply into debt to the winning powers to pay back the winning countries’ war costs with these debts payable in gold.  The United States was then clearly recognized as a leading power so it played a role in shaping the new world order.  In fact the term “new world order” came about in reference to US President Woodrow Wilson’s vision for how countries would operate in pursuit of their collective interest through a global governance system (the League of Nations) which was a vision that quickly failed.  After World War I the US chose to remain more isolationist while Britain continued to expand and oversee its global colonial empire.  The monetary system in the immediate post-war period was in flux.  While most countries endeavored to restore gold convertibility, currency stability against gold only came after a period of sharp devaluations and inflation.The large foreign debt burdens placed on Germany set the stage for 1) Germany’s post-war inflationary depression from 1920 to 1923 that wiped out the debts and was followed by Germany’s strong economic and military recovery, and 2) a decade of peace and prosperity elsewhere, which became the “Roaring ’20s.”  During that time the United States also followed a classic capitalist approach to resource allocation and New York became a rival financial center to London, channeling debt and investments into various businesses. Other countries became more competitive and prosperous and increasingly challenged the leading powers.  Most importantly Germany, Japan, and the US got stronger economically and militarily in the classic ways laid out in Chapter 1.  However, the US was isolationist and didn’t have a big colonial empire past its borders so it was essentially out of the emerging conflict.  As shown in the chart of the standing of empires above, Germany and Japan both gained in power relative to the UK during this interwar period, though the UK remained stronger.  As is typical, the debts and the wealth gaps that were built up in the 1920s led to the debt bubbles that burst in 1929 which led to depressions, which led to the printing of money, which led to devaluations of currencies and greater internal and external conflicts over wealth and power in the 1930s.  For example, in the United States and the UK, while there were redistributions of wealth and political power, capitalism and democracy were maintained, while in Germany, Japan, Italy, and Spain they were not maintained.  Russia played a significant peripheral role in ways I won’t delve into.  China at the time was weak, fragmented, and increasingly controlled by a rising and increasingly militaristic and nationalistic Japan.  To make a long story short, the Japanese and Germans started to make territorial expansions in the early to mid-1930s, which led to wars in Europe and Asia in the late 1930s that ended in 1945.   As is typical, before all-out wars were declared there was about a decade of economic, technological, geopolitical, and capital wars when the conflicting powers approached comparability and tested and tried to intimidate the other powers.  While 1939 and 1941 are known as the official start of the wars in Europe and the Pacific, the wars really started about 10 years before that, as economic conflicts that were at first limited progressively grew into World War II.  As Germany and Japan became more expansionist economic and military powers, they increasingly competed with the UK, US, and France for both resources and influence over territories. That brought about the second world war which, as usual, was won by the winning countries coming up with new technologies (the nuclear bomb, while the most important, was just one of the newly invented weapons).  Over 20 million died directly in the military conflicts, and the total death count was still higher.  So 1930-45, which was a period of depression and war, was a terrible time.  The Rise of the American Empire and the US Dollar After World War IIAs is typical after wars, the winning powers—most importantly the US, Britain, and Russia—met to set out the new world order.  While the Bretton Woods Conference, Yalta Conference, and Potsdam Conference were the most noteworthy, several other meetings occurred that shaped the new world order, which included carving up the world and redefining countries and areas of influence and establishing a new money and credit system.  In this case, the world was divided into the US-controlled capitalist/democratic countries and Russia-controlled communist and autocratically controlled countries, each with their own monetary systems.  Germany was split into pieces, with the United States, Great Britain, and France having control of the West and Russia having control of the East.  Japan was under US control and China returned to a state of civil war, mostly about how to divide the wealth, which was between communists and capitalists (i.e., the Nationalists).  Unlike after World War I when the United States chose to be relatively isolationist, after World War II the United States took the primary leadership role as it had most of the economic, geopolitical, and military responsibility.    The US followed a capitalist system.  The new monetary system of the US-led countries had the dollar linked to gold and had most other countries’ currencies tied to the dollar.  This system was followed by over 40 countries.  Because the US had around two-thirds of the world’s gold then and because the US was much more powerful economically and militarily than any other country, this monetary system has worked best and carried on until now.  As for the other countries that were not part of this system—most importantly Russia and those countries that were brought into the Soviet Union and the satellite countries that the Soviets controlled—they were built on a much weaker foundation that eventually broke down.  Unlike after World War I, when the losing countries were burdened with large debts, countries that were under US control, including the defeated countries, received massive financial aid from the US via the Marshall Plan.  At the same time the currencies and debts of the losing countries were wiped out, with those holding them losing all of their wealth in them.  Great Britain was left heavily indebted from its war borrowings and faced the gradual end of the colonial era which would lead to the unraveling of its empire which was becoming uneconomic to have.During this post-World War II period the United States, its allies, and the countries that were under its influence followed a classic capitalist-democratic approach to resource allocation.  New York flourished as the world’s pre-eminent financial center, and a new big debt and capital markets cycle began.  That produced what has thus far been a relatively peaceful and prosperous 75-year period that has brought us to today.As is typical of this peaceful and prosperous part of the cycle, in the 1950-70 period there was productive debt growth and equity market development that were essential for financing innovation and development early on.  That eventually led to too much debt being required to finance both war and domestic needs—what was called “guns and butter.”  The Vietnam War and the “War on Poverty” occurred in the US.  Other countries also became overly indebted and the British indebtedness became over-leveraged which led to a number of currency devaluations, most importantly the breakdown of the Bretton Woods monetary system (though countries like the UK and Italy had already devalued prior to that time).  Then in 1971, when it was apparent that the US didn’t have enough gold in the bank to meet the claims on gold that it had put out, the US defaulted on its promise to deliver gold for paper dollars which ended the Type 2 gold-backed monetary system, and the world moved to a fiat monetary system.  As is typical, this fiat monetary system initially led to a wave of great dollar money and debt creation that led to a big wave of inflation that carried until 1980-82 and led to the worst economic downturn since the Great Depression.  It was followed by three other waves of debt-financed speculations, bubbles, and busts—1) the 1982 and 2000 money and credit expansion that produced a dot-com bubble that led to the 2000-01 recession, 2) the 2002-07 money and credit expansion that produced a real estate bubble that led to the 2008 Great Recession, and 3) the 2009-19 money and credit expansion that produced the investment bubble that preceded the COVID-19 downturn.  Each of these cycles raised debt and non-debt obligations (e.g., for pensions and healthcare) to progressively higher levels and led the reserve currency central banks of the post-war allies to push interest rates to unprecedented low levels and to print unprecedented amounts of money.  Also classically, the wealth, values, and political gaps widened within countries, which increases internal conflicts during economic downturns.  That is where we now are.  During this prosperous post-war period many countries became more competitive with the leading powers economically and militarily. The Soviet Union/Russia initially followed a communist resource allocation approach as did China and a number of other smaller countries.  None of these countries became competitive following this approach.  However, the Soviet Union did develop nuclear weapons to become militarily threatening and gradually a number of other countries followed in developing nuclear weapons.  These weapons were never used because using them would produce mutually assured destruction.  Because of its economic failures the Soviet Union/Russia could not afford to support a) its empire, b) its economy, and c) its military at the same time in the face of US President Ronald Reagan’s arms race spending.  As a result the Soviet Union broke down in 1991 and abandoned communism.  The breakdown of its money/credit/economic system was disastrous for it economically and geopolitically for most of the 1990s.  In the 1980-95 period most communist countries abandoned classic communism and the world entered a very prosperous period of globalization and free-market capitalism. In China, Mao Zedong’s death in 1976 led Deng Xiaoping to a shift in economic policies to include capitalist elements including private ownership of large businesses, the development of debt and equities markets, great technological and commercial innovations, and even the flourishing of billionaire capitalists—all, however, under the strict control of the Communist Party. As a result of this shift and the simultaneous shift in the world to greater amounts of globalism China grew much stronger in most ways. For example, since I started visiting China in 1984, the education of its population has improved dramatically, the real per capita income has multiplied by 24, and it has become the largest country in the world in trade (exceeding the US share of world trade), a rival technology leader, the holder of the greatest foreign reserves assets in the world by a factor of over two, the largest lender/investor in the emerging world, the second most powerful military power, and a geopolitical rival of the United States.  And it is growing in power at a significantly faster pace than the United States and other “developed countries.”  At the same time, we are in a period of great inventiveness due to advanced information/data management and artificial intelligence supplementing human intelligence with the Americans and Chinese leading the way.  As shown at the outset of Chapter 1, human adaptability and inventiveness has proven to be the greatest force in solving problems and creating advances.  Also, because the world is richer and more skilled than ever before, there is a tremendous capacity to make the world better for more people than ever if people can work together to make the whole pie as big as possible and to divide it well.  That brings us to where we now are.  As you can see, all three of these rises and declines followed the classic script laid out in Chapter 1 and summarized in the charts at the beginning of this chapter, though each had its own particular turns and twists.    Now let’s look at these cases, especially the declines, more closely.A Closer Look at the Rises and Declines of the Leading Empires Over the Last 500 YearsThe Dutch Empire and the Dutch GuilderBefore we get to the collapse of the Dutch empire and the Dutch guilder let’s take a quick look at the whole arc of its rise and decline.  While I previously showed you the aggregated power index for the Dutch empire, the chart below shows the eight powers that make it up from the ascent around 1575 to the decline around 1780.  In it, you can see the story behind the rise and decline. No alt text provided for this image
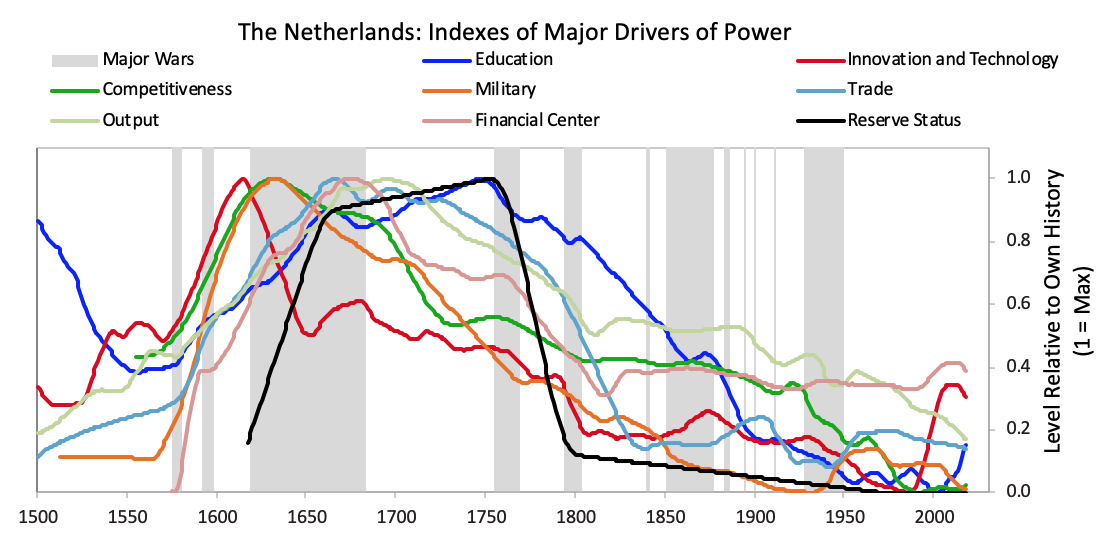
After declaring independence in 1581, the Dutch fought off the Spanish and built a global trading empire that became responsible for over a third of global trade largely via the first mega-corporation, the Dutch East India Company.  As shown in the chart above, with a strong educational background the Dutch innovated in a number of areas.  They produced roughly 25% of global inventions in the early 17th century,[4] most importantly in shipbuilding, which led to a great improvement in Dutch competitiveness and its share of world trade.  Propelled by these ships and the capitalism that provided the money to fuel these expeditions, the Dutch became the largest traders in the world, accounting for about one-third of world trade.[5]  As the ships traveled around the world, the Dutch built a strong military to defend them and their trade routes. As a result of this success they got rich.  Income per capita rose to over twice that of most other major European powers.[6]They invested more in education.  Literacy rates became double the world average.  They created an empire spanning from the New World to Asia, and they formed the first major stock exchange with Amsterdam becoming the world’s most important financial center.  The Dutch guilder became the first global reserve currency, accounting for over a third of all international transactions.[7]  For these reasons over the course of the late 1500s and 1600s, the Dutch became a global economic and cultural power.  They did all of this with a population of only 1-2 million people.  Below is a brief summary of the wars they had to fight to build and hold onto their empire.  As shown, they were all about money and power.Eighty Years’ War (1566-1648): This was a revolt by the Netherlands against Spain (one of the strongest empires of that era), which eventually led to Dutch independence.  The Protestant Dutch wanted to free themselves from the Catholic rule of Spain and eventually managed to become de facto independent.  Between 1609 and 1621, the two nations had a ceasefire.  Eventually, the Dutch were recognized by Spain as independent in the Peace of Munster, which was signed together with the Treaty of Westphalia, ending both the Eighty Years’ War as well as the Thirty Years’ War.[8]  First Anglo-Dutch War (1652-1654): This was a trade war.  More specifically, in order to protect its economic position in North America and damage the Dutch trade that the English were competing with, the English Parliament passed the first of the Navigation Acts in 1651 that mandated that all goods from its American colonies must be carried by English ships, which set off hostilities between the two countries.[9]The Dutch-Swedish War (1657–1660): This war centered around the Dutch wanting to maintain low tolls on the highly profitable Baltic trade routes.  This was threatened when Sweden declared war on Denmark, a Dutch ally.  The Dutch defeated the Swedes and maintained the favorable trade arrangement.[10]The Second Anglo-Dutch War (1665–1667): England and the Netherlands fought again over another trade dispute, which again ended with a Dutch victory.[11]The Franco-Dutch War (1672-1678) and the Third Anglo-Dutch War (1672-1674): This was also a fight over trade.  It was between France and England on one side and the Dutch (called the United Provinces), the Holy Roman Empire, and Spain on the other.[12]  The Dutch largely stopped French plans to conquer the Netherlands and forced France to reduce some of its tariffs against Dutch trade,[13] but the war was more expensive than previous conflicts, which increased their debts and hurt the Dutch financially.The Fourth Anglo-Dutch War (1780-1784): This was fought between the Dutch and the rapidly strengthening British, partially in retaliation for Dutch support of the US in the American Revolution.  The war ended in significant defeat for the Dutch, and the costs of the fighting and eventual peace helped usher in the end of the guilder as a reserve currency.[14]The chart below shows the Dutch power index with the key war periods noted.  No alt text provided for this image
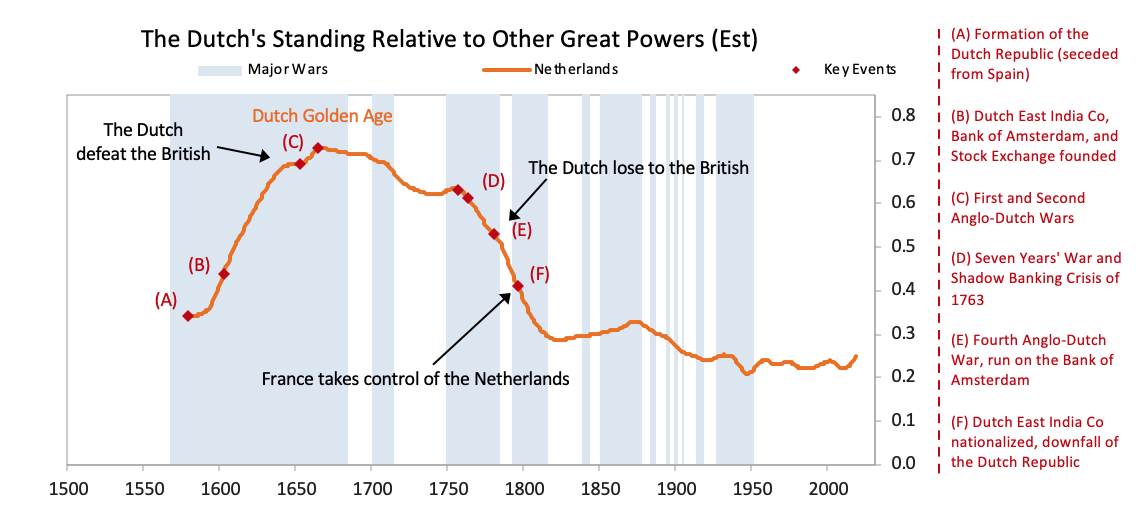
As shown, the seeds of Dutch decline were sown in the latter part of the 17th century as they started to lose their competitiveness and became overextended globally trying to support an empire that had become more costly than profitable.  Increased debt-service payments squeezed them while their worsening competitiveness hurt their income from trade.  Earnings from business abroad also fell.  Wealthy Dutch savers moved their cash abroad both to get out of Dutch investments and into British investments, which were more attractive due to strong earnings growth and higher yields.[15] While debt burdens had grown through most of the 1700s,[16]the Dutch guilder remained widely accepted around the world as a reserve currency so it held up solely because of the functionality of and faith in it.[17]  (As explained earlier, reserve currency status classically lags the decline of other key drivers of the rise and fall of empires.)  As shown by the black line in the first chart above (designating the extent the currency is used as a reserve currency) the guilder remained widely used as a global reserve currency after the Dutch empire started to decline, up until the Fourth Anglo-Dutch War, which began in 1780 and ended in 1784.[18]The simmering conflict between the rising British and the declining Dutch had escalated after the Dutch traded arms with the colonies during the American Revolution.[19]  In retaliation the English delivered a massive blow to the Dutch in the Caribbean and ended up controlling Dutch territory in the East and West Indies.[20]  The war required heavy expenditure by the Dutch to rebuild their dilapidated navy: the Dutch East India Company lost half its ships[21] and access to its key trade routes while heavily borrowing from the Bank of Amsterdam to stay alive.  And the war forced the Dutch to accumulate large debts beyond these.[22]  The main reason the Dutch lost the war was that they let their navy become much weaker than Britain’s because of disinvestment into military capacity in order to spend on domestic indulgences.[23] In other words, they tried to finance both guns and butter with their reserve currency, didn’t have enough buying power to support the guns despite their great ability to borrow due to their having the leading reserve currency, and became financially and militarily defeated by the British who were stronger in both respects.Most importantly, this war destroyed the profitability and balance sheet of the Dutch East India Company.[24] While it was already in decline due to its reduced competitiveness, it ran into a liquidity crisis after a collapse in trade caused by British blockades on the Dutch coast and in the Dutch East Indies.[25]  As shown below, it suffered heavy losses during the Fourth Anglo-Dutch War and began borrowing aggressively from the Bank of Amsterdam because it was too systemically important for the Dutch government. No alt text provided for this image
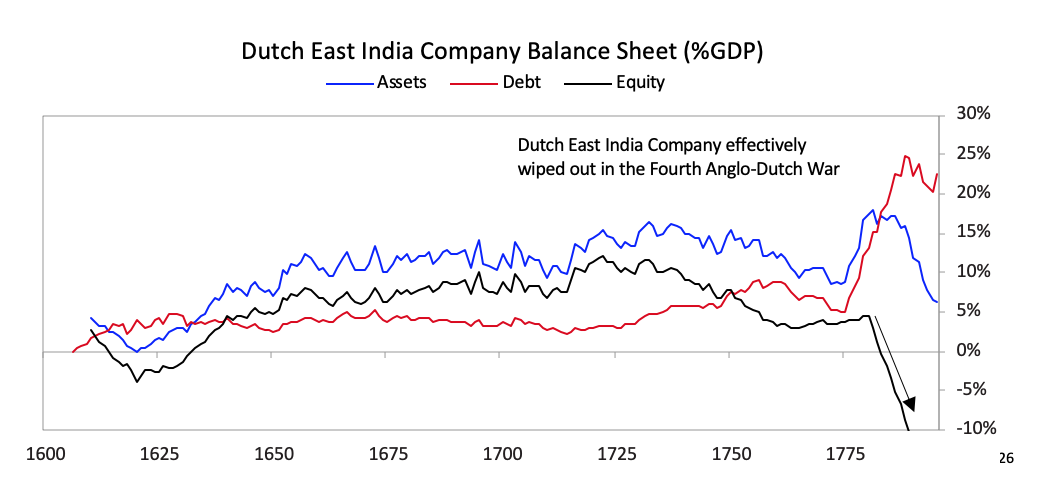
[26]As shown in the chart below the Dutch East India Company, which was essentially the Dutch economy and military wrapped into a company, started to make losses in 1780, which became enormous during the Fourth Anglo-Dutch War. No alt text provided for this image
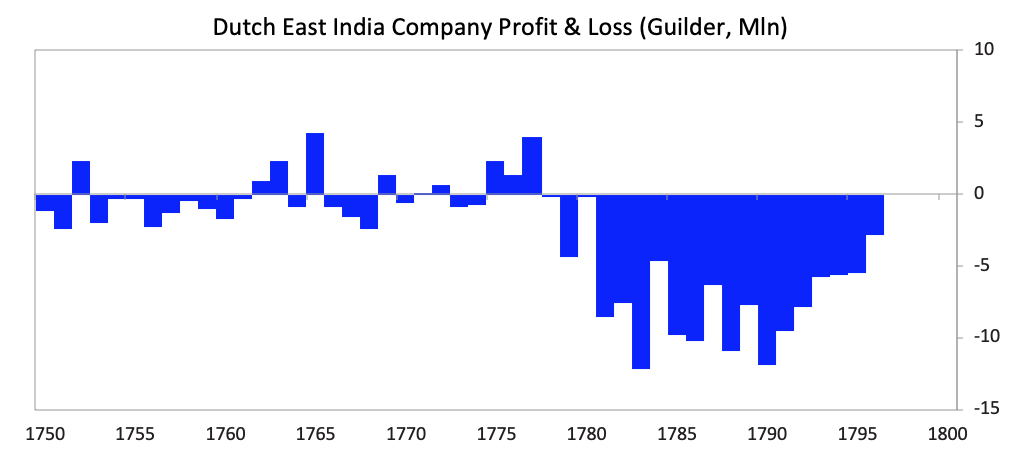
As deposit holders at the Bank of Amsterdam realized the bank was “lending” freshly printed guilders to save the Dutch East India Company, there was a run on the Bank of Amsterdam.[27]  As investors pulled back and borrowing needs increased, gold was preferred to paper money, those with paper money exchanged it for gold at the Bank of Amsterdam, and it became clear that there wouldn’t be enough gold.  The run on the bank and the run on the guilder accelerated throughout the war, as it became increasingly apparent that the Dutch would lose and depositors could anticipate that the bank would print more money and have to devalue the guilder.[28]  Guilders were backed by precious metals, but as the supply of guilders rose and investors could see what was happening they turned their guilders in for gold and silver so the ratio of claims on gold and silver rose, which caused more of the same until the Bank of Amsterdam was wiped out of its precious metal holdings.  The supply of guilders continued to soar while demand for them fell. No alt text provided for this image
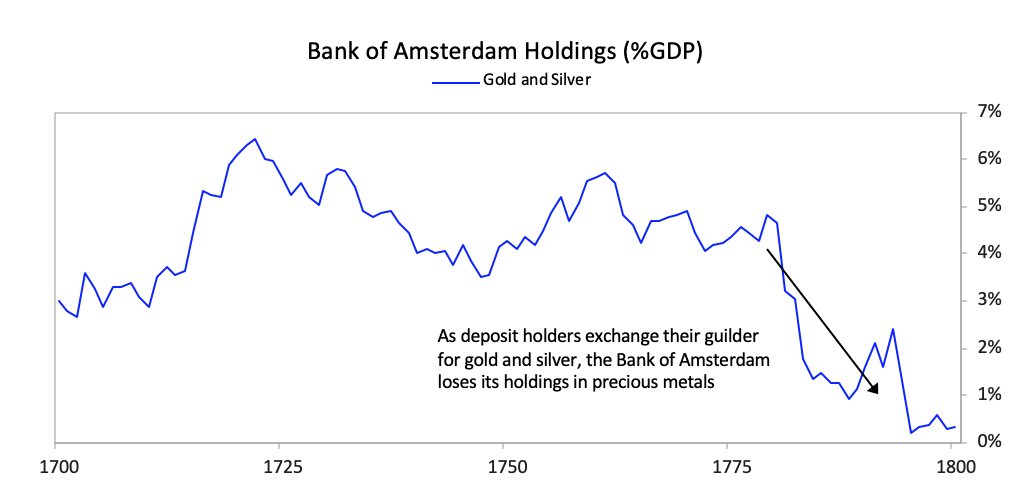
The Bank of Amsterdam had no choice since the company was too important to allow to fail both because of its significance to the economy and its outstanding debt in the Dutch financial system, so the Bank of Amsterdam began “lending” large sums of newly printed guilders to the company. During the war, policy makers also used the bank to lend to the government.[29]  The chart below shows this explosion of loans on the bank’s balance sheet through the Fourth Anglo-Dutch War (note: there was about 20 million bank guilder outstanding at the start of the war).[30]No alt text provided for this image
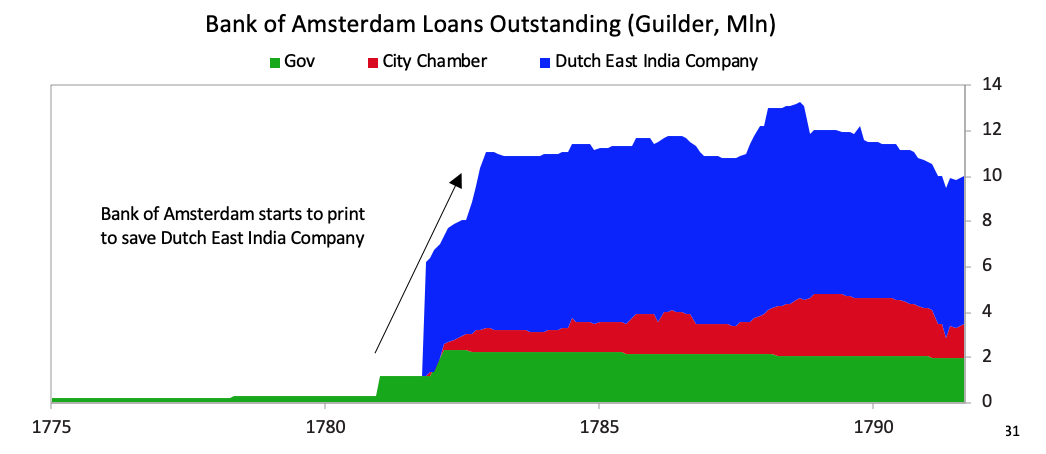
[31]Interest rates rose and the Bank of Amsterdam had to devalue, undermining the credibility of the guilder as a storehold of value.[32] Over the years, and at this moment of crisis, the bank had created many more “paper money” claims on the hard money in the bank than could be met so that led to a classic run on the Bank of Amsterdam, which led to the collapse of the Dutch guilder.[33]  It also led to the British pound clearly replacing the Dutch guilder as the leading reserve currency.  What happened to the Dutch was classic as described in both Chapter 1’s very brief summary of why empires rise and fall and in Chapter 2’s description of how money, credit, and debt work.  As for the money, credit, and debt cycle, the Bank of Amsterdam started with a Type 1 monetary system that morphed into a Type 2 monetary system.  It started with just coins that led to the bank having a 1:1 backing of paper money by metal, so the bank provided a more convenient form of hard money.  The claims on money were then allowed to rise relative to the hard money to increasingly become a Type 2 monetary system, in which paper money seems to acquire a value itself as well as a claim on hard money (coins), though the money wasn’t fully backed.  This transition usually happens at times of financial stress and military conflict.  And it is risky because the transition decreases trust in the currency and adds to the risk of a bank-run-like dynamic.  While we won’t go deeply into the specifics of the war, the steps taken by policy makers during the period led to the loss of Dutch financial power so are worth describing because they are so archetypical when there is a clear shift in power and the losing country has a bad income statement and balance sheet.  This period was like that and ended with the guilder supplanted by the pound as the world’s reserve currency and London succeeding Amsterdam as the world’s financial center.  Deposits (i.e., holdings of short-term debt) of the Bank of Amsterdam, which had been a reliable storehold of wealth for nearly two centuries, began to trade at large discounts to guilder coins (which were made of gold and silver).[34]  The bank used its holdings of other countries’ debt (i.e., its currency reserves) to buy its currency on the open market to support the value of deposits, but it lacked adequate foreign currency reserves to support the guilder.[35]  Accounts backed by coin held at the bank plummeted from 17 million guilder in March 1780 to only 300,000 in January 1783 as owners of these gold and silver coins wanted to get them rather than continue to hold the promises of the Bank of Amsterdam to deliver them.[36]The running out of money by the Bank of Amsterdam marked the end of the Dutch empire and the guilder as a reserve currency.  In 1791 the bank was taken over by the City of Amsterdam,[37] and in 1795 the French revolutionary government overthrew the Dutch Republic, establishing a client state in its place.[38] After being nationalized in 1796, rendering its stock worthless, the Dutch East India Company’s charter expired in 1799.[39]The following charts show the exchange rates between the guilder and the pound/gold; as it became clear that the bank no longer had any credibility and that the currency was no longer a good storehold of wealth, investors fled to other assets and currency.[40]No alt text provided for this image
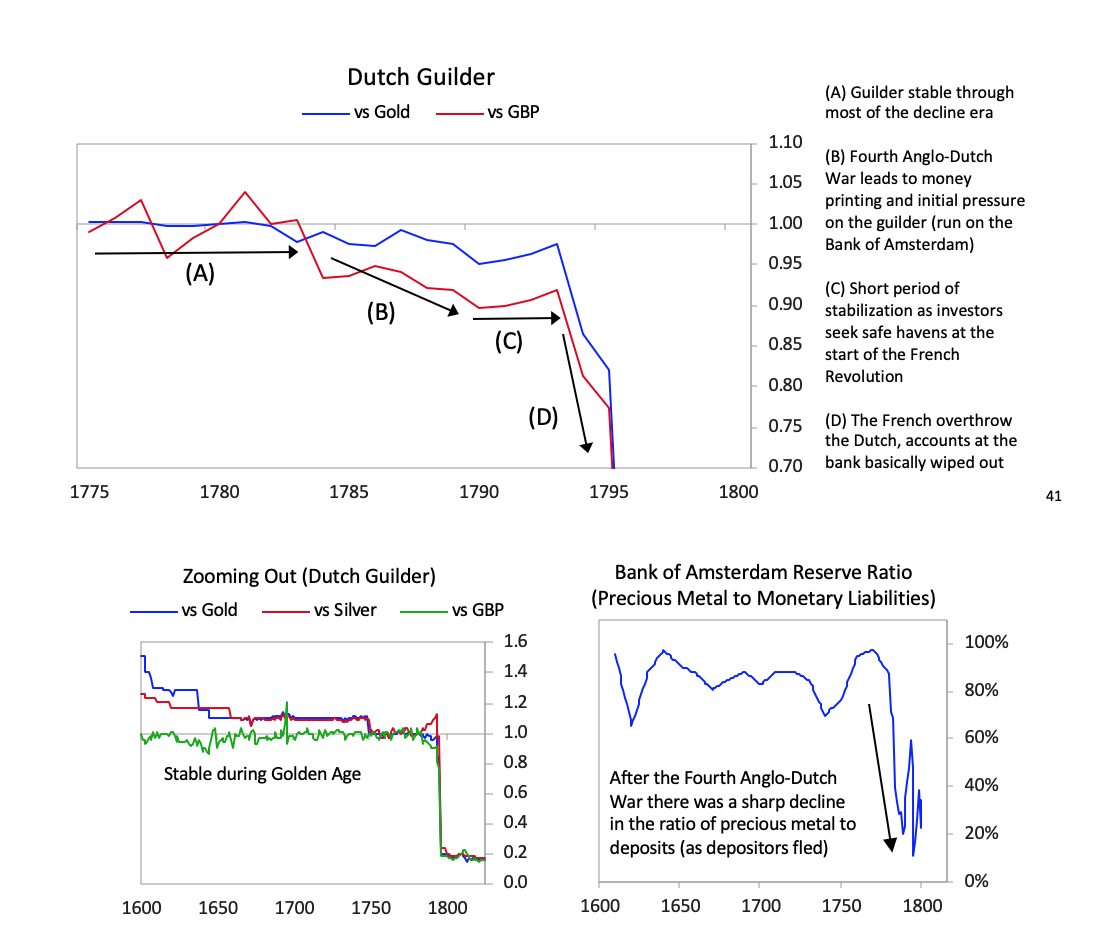
[41]The chart below shows the returns of holding the Dutch East India Company for investors starting in various years.  As with most bubble companies, it originally did great, with great fundamentals, which attracted more investors even as its fundamentals started to weaken, but it increasingly got into debt, until the failed fundamentals and excessive debt burdens broke the company. No alt text provided for this image
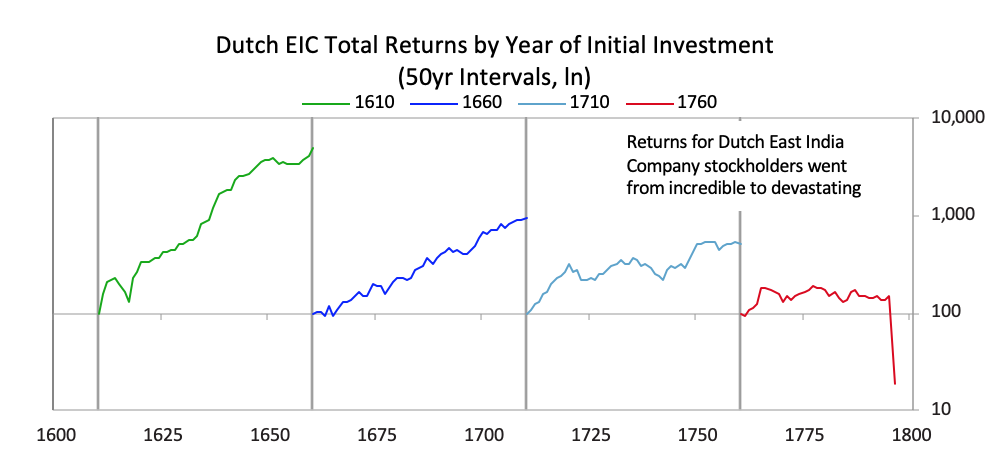
As is typical, with the decline in power of the leading empire and the rise in power of the new empire, the returns of investment assets in the declining empire fell relative to the returns of investing in the rising empire.  For example, as shown below, the returns on investments in the British East India Company far exceeded those in the Dutch East India Company, and the returns of investing in Dutch government bonds were terrible relative to the returns of investing in English government bonds.  This was reflective of virtually all investments in these two countries. No alt text provided for this image
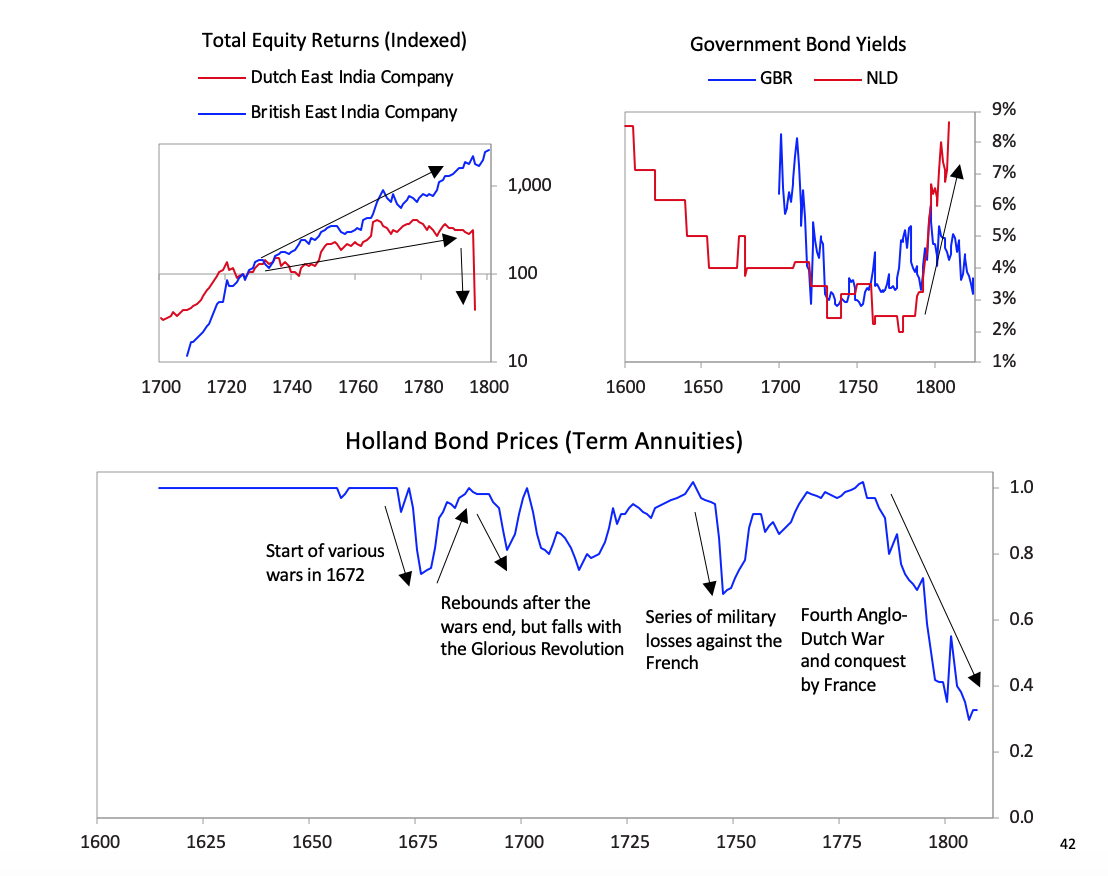
[42]The British Empire and the British PoundBefore we get to the collapse of the British empire and the British pound, let’s take a quick look at the whole arc of its rise and decline.  While I previously showed you the aggregated power index for the British empire, the chart below shows the eight powers that make it up.  It shows these from the ascent around 1700 to the decline in the early 1900s.  In it, you can see the story behind the rise and decline.  No alt text provided for this image
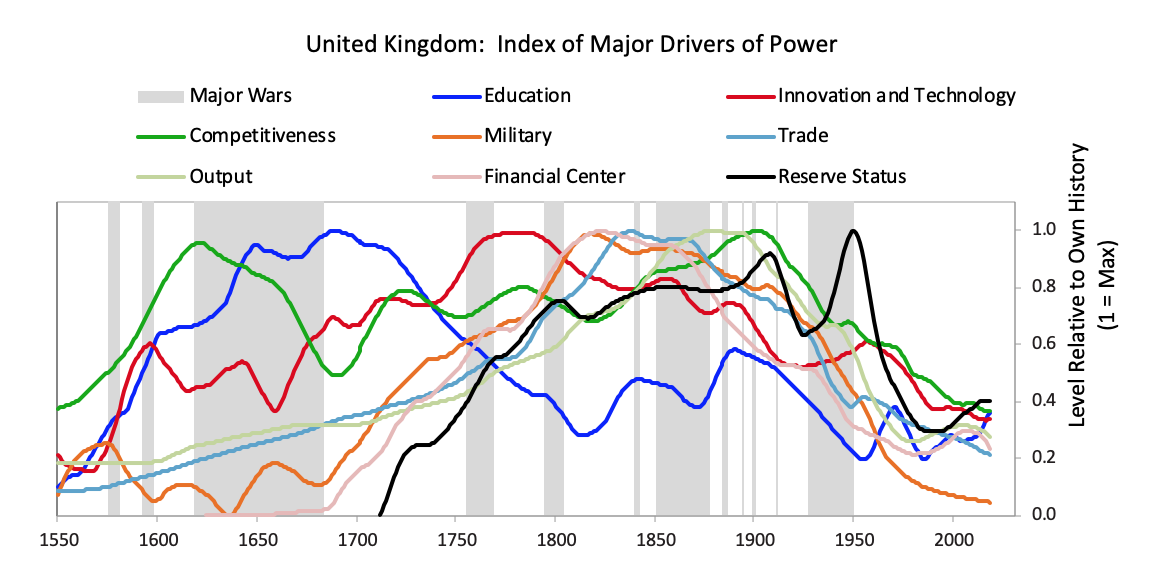
The British empire’s rise began before 1600, with steadily strengthening competitiveness, education, and innovation/technology—the classic leading factors for a power’s rise.  As shown and previously described, in the late 1700s the British military power became pre-eminent and it beat its leading economic competitor and the leading reserve currency empire of its day in the Fourth Anglo-Dutch War.  It also successfully fought other European rivals like France in a number of conflicts that culminated in the Napoleonic Wars in the early 1800s.  Then it became extremely rich by being the dominant economic power.  At its peak in the 19th century, the UK’s 2.5% of the world’s population produced 20% of the world’s income, and the UK controlled over 40% of global exports.  This economic strength grew in tandem with a strong military, which, along with the privately driven conquests of the British East India Company, drove the creation of a global empire upon which “the sun never set,” controlling over 20% of the world’s land mass and 25% of the global population prior to the outbreak of World War I.  With a lag, as is classic, its capital—London—emerged as the global financial center and its currency—the pound—emerged as the leading global reserve currency.  As is typical its reserve status remained well after other measures of power started declining in the late 19th century and as powerful rivals like the US and Germany rose.  As shown in the chart above, almost all of the British empire’s relative powers began to slip as competitors emerged around 1900.  At the same time wealth gaps were large and internal conflicts over wealth were emerging.  As you know, despite winning both World War I and World War II the British were left with large debts, a huge empire that was more costly than profitable, numerous rivals that were more competitive, and a population that had big wealth gaps which led to big political gaps.  As I previously summarized what happened in the 1914 to post-World War II period, I will skip ahead to the end of World War II in 1945 and the start of the new world order that we are now in.  I will be focusing on how the pound lost its reserve currency status.  Although the US had overtaken the UK militarily, economically, politically, and financially long before the end of World War II, it took more than 20 years after the war for the British pound to fully lose its status as an international reserve currency.  Just like the world’s most widely spoken language becomes so deeply woven into the fabric of international dealings that it is difficult to replace, the same is true of the world’s most widely used reserve currency.  In the case of the British pound, other countries’ central banks continued to hold a sizable share of their reserves in pounds through the 1950s, and about half of all international trade was denominated in sterling in 1960.  Still, the pound began to lose its status right at the end of the war because smart folks could see the UK’s increased debt load, its low net reserves, and the great contrast with the United States’ financial condition (which emerged from the war as the world’s pre-eminent creditor and with a very strong balance sheet).  The decline in the British pound was a chronic affair that happened through several significant devaluations over many years.  After efforts at making the pound convertible failed in 1946-47, the pound devalued by 30% against the dollar in 1949.  Though this worked in the short term, over the next two decades the declining competitiveness of the British led to repeated balance of payments strains that culminated with central banks actively selling sterling reserves to accumulate dollar reserves following the devaluation of 1967.  Around this time the deutschmark began to re-emerge and took the pound’s place as the second-most widely held reserve currency.  The charts below paint the picture.  No alt text provided for this image
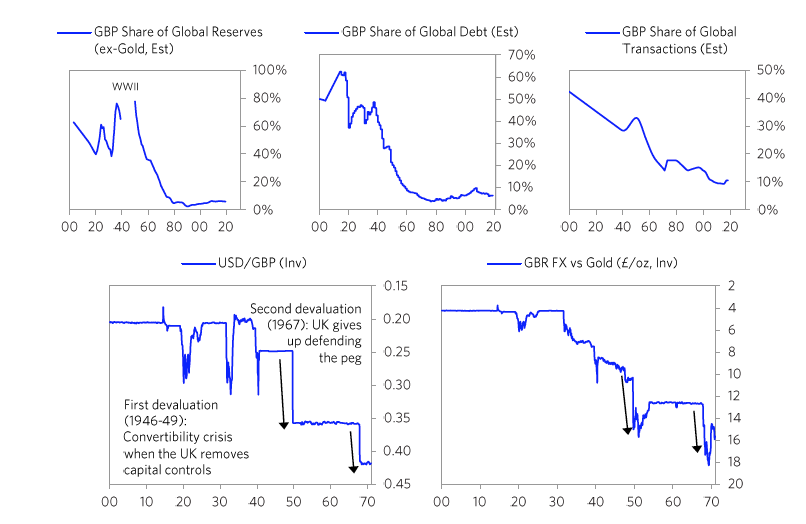
On the following pages we will cover in greater detail the specific stages of this decline, firstly with the convertibility crisis of 1947 and the 1949 devaluation, secondly with the gradual evolution of the pound’s status relative to the dollar through the 1950s and early 1960s, and thirdly with the balance of payments crisis of 1967 and subsequent devaluation.  We will focus in on the currency crises.  1)     The Pound’s Suspended Convertibility in 1946 and Its Devaluation in 1949The 1940s are frequently referred to as “crisis years”[43] for sterling.  The war required the UK to borrow immensely from its allies and colonies,[44]and those obligations were required to be held in sterling.  These war debts financed about a third of the war effort.  When the war ended, the UK could not meet its debt obligations without the great pain of raising taxes or cutting government spending, so it necessarily mandated that its debt assets (i.e., its bonds) could not be proactively sold by its former colonies.  As such, the UK emerged from World War II with strict controls on foreign exchange.  The Bank of England’s approval was required to convert pounds into dollars, whether to buy US goods or purchase US financial assets (i.e., current and capital account convertibility was suspended).  To ensure the pound would function as an international reserve currency in the post-war era, and to prepare the global economy for a transition to the Bretton Woods monetary system, convertibility would have to be restored.  However, because the US dollar was now the international currency of choice, the global economy was experiencing a severe shortage of dollars at the time.  Virtually all Sterling Area countries (the UK and the Commonwealth countries) relied on inflows from selling goods and services and from attracting investments in dollars to get the dollars they needed while they were forced to hold their sterling-denominated bonds.  The UK experienced acute balance of payments problems due to its poor external competitiveness, a domestic fuel crisis, and large war debts undermining faith in the pound as a storehold of wealth.  As a result, the first effort to restore convertibility in 1947 failed completely, and it was soon followed by a large devaluation (of 30%) in 1949, to restore some competitiveness.[45]Coming into the period, there were concerns that too quick a return to convertibility would result in a run on the pound, as savers and traders shifted to holding and transacting in dollars all at once.  However, the US was anxious for the UK to restore convertibility as soon as possible as restrictions on convertibility were reducing US export profits and reducing liquidity in the global economy.[46]  The Bank of England was also eager to remove capital controls in order to restore the pound’s role as a global trading currency, increase financial sector revenues in London, and encourage international investors to continue saving in sterling [47] (a number of governments of European creditors, including Sweden, Switzerland, and Belgium, were having increasing conflicts with the UK over the lack of convertibility).[48] An agreement was reached after the war, under which the UK would reintroduce convertibility swiftly, and the US would provide the UK with a loan of $3.75 billion [49] (about 10% of UK GDP).  While the loan offered some buffer against a potential run on the pound, it did not change the underlying imbalances in the global economy. When partial convertibility was introduced in July 1947, the pound came under considerable selling pressure.  As the UK and US governments were against devaluation (as memories of the competitive devaluations in the 1930s were fresh on everyone’s minds), [50] the UK and other Sterling Area countries turned to austerity and reserve sales to maintain the peg to the dollar.  Restrictions were imposed on the import of “luxury goods” from the US, defense expenditure was slashed, dollar and gold reserves were drawn down, and agreements were made between sterling economies not to diversify their reserve holdings to the dollar.[51] Prime Minister Clement Attlee gave a dramatic speech on August 6, 1947, calling for the spirit of wartime sacrifices to be made once again in order to defend the pound:     “In 1940 we were delivered from mortal peril by the courage, skill, and self-sacrifice of a few.  Today we are engaged in another battle for Britain.  This battle cannot be won by the few.  It demands a united effort by the whole nation.  I am confident that this united effort will be forthcoming and that we shall again conquer.”[52]Immediately following the speech, the run on the pound accelerated.  Over the next five days, the UK had to spend down $175 million of reserves to defend the peg.[53] By the end of August, convertibility was suspended, much to the anger of the US and other international investors who had bought up sterling assets in the lead-up to convertibility hoping that they would soon be able to convert those holdings to dollars.  The governor of the National Bank of Belgium even threatened to stop transacting in sterling, requiring a diplomatic intervention.[54]The devaluation came two years later, as policy makers in both the UK and the US realized that the pound couldn’t return to convertibility at the current rate.  UK exports were not competitive enough in global markets to earn the foreign exchange needed to support the pound, reserves were dwindling, and the US was unwilling to continue shoring up the pound with low interest rate loans.  An agreement was reached to devalue the pound versus the dollar in order to boost UK competitiveness, help create a two-way currency market, and speed up a return to convertibility.[55]  In September 1949, the pound was devalued by 30% versus the dollar.  Competitiveness returned, the current account improved, and by the mid-to-late 1950s, full convertibility was restored.[56]  The charts below No alt text provided for this image
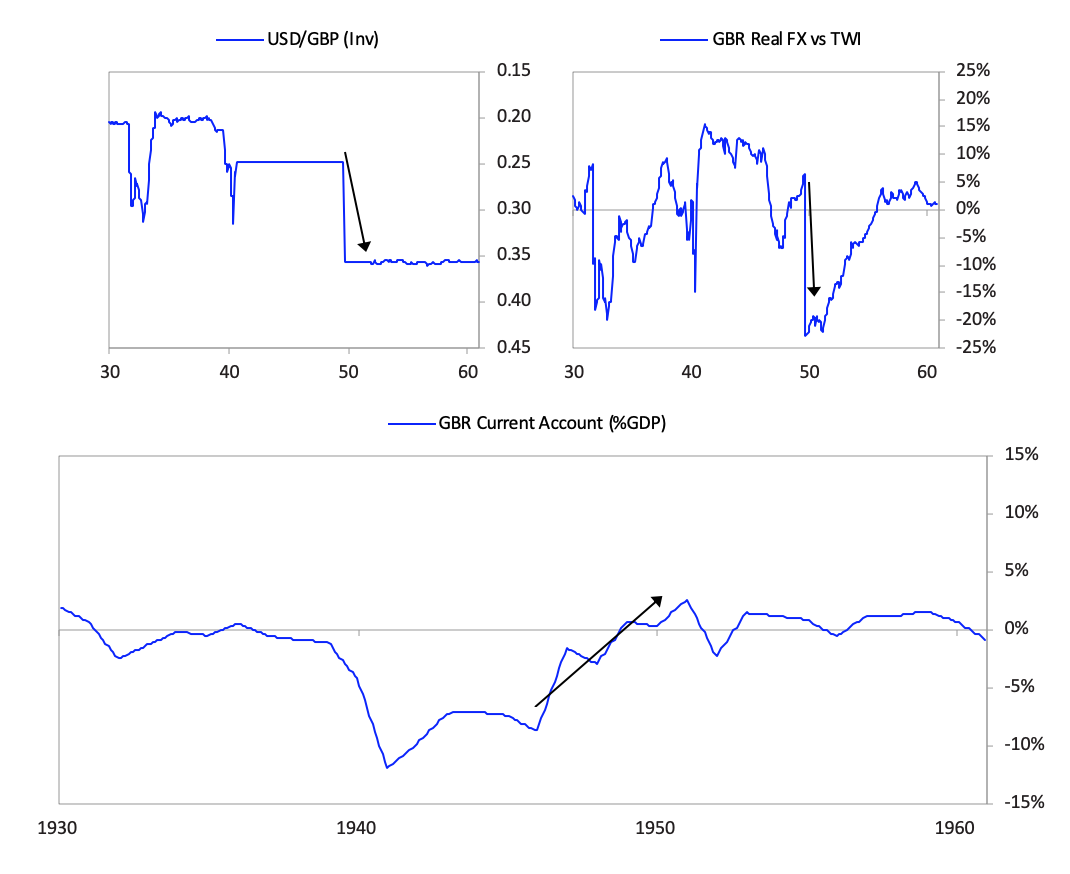
The currency move, which devalued sterling debt, did not lead to a panic out of sterling debt as much as one might have expected especially in light of how bad the fundamentals for sterling debt remained.  That is because a very large share of UK assets was held by the US government, which was willing to take the valuation hit in order to restore convertibility, and by Sterling Area economies, such as India and Australia, whose currencies were pegged to the pound for political reasons.[57]  These Commonwealth economies, for geopolitical reasons, supported the UK’s decision and followed by devaluing their own currencies versus the dollar, which lessened the visibility of the loss of wealth from the devaluation. Still, the immediate post-war experience made it clear to knowledgeable observers that the pound was vulnerable to more weakness and would not be able to enjoy the same international role it had prior to World War II.1) The Failed International Efforts to Support the Pound in the 1950s and 1960s and the Devaluation of 1967Though the devaluation helped in the short term, over the next two decades, the pound would face recurring balance of payments strains. These strains were very concerning to international policy makers who feared that a collapse in the value of sterling or a rapid shift away from the pound to the dollar in reserve holdings could prove highly detrimental to the new Bretton Woods monetary system (particularly given the backdrop of the Cold War and concerns around communism).  As a result, numerous arrangements were made to try to shore up the pound and preserve its role as a source of international liquidity.  These included the Bilateral Concerté (1961-64), in which major developed world central banks gave support to countries via the Bank of International Settlements, including multiple loans to the UK and the BIS Group Arrangement 1 (1966-71), which provided swaps to the UK to offset future pressure from potential falls in sterling reserve holdings.[58]In addition to these wider efforts, the UK’s status as the head of the Sterling Area let it mandate that all trade within the Sterling Area would continue to be denominated in pounds and all their currencies would be pegged to sterling. As these economies had to maintain a peg to the pound, they continued to accumulate FX reserves in sterling well after other economies had stopped doing so (e.g., Australia kept 90% of its reserves in sterling as late as 1965).[59]  Foreign loans issued in the UK during the period were also almost exclusively to the Sterling Area. The result of all this is that for the 1950s and early 1960s, the UK is best understood as a regional economic power and sterling as a regional reserve currency.[60]  Yet all these measures didn’t fix the problem that the UK owed too much money and was uncompetitive, so it didn’t earn enough money to both pay its debts and pay for what it needed to import. Rearrangements were essentially futile stop-gap measures designed to hold back the changing tide. They helped keep the pound stable between 1949 and 1967. Still, sterling needed to be devalued again in 1967. By the mid-1960s, the average share of central bank reserves held in pounds had fallen to around 20%, while international trade was overwhelmingly denominated in dollars (about half). However, many emerging markets and Sterling Area countries continued to hold about 50% of their reserves in pounds and continued to denominate much of their trade with each other and the UK in sterling. This effectively ended following a series of runs on the pound in the 1960s. As in many other balance of payments crises, policy makers used a variety of means to try to maintain the currency peg to the dollar, including spending down reserves, raising rates, and using capital controls. In the end they were unsuccessful, and after the UK devalued by 14% versus the dollar in 1967, even Sterling Area countries were unwilling to hold their reserves in pounds, unless the UK guaranteed their underlying value in dollars.Throughout the 1960s, the UK was forced to defend the peg to the dollar by selling about half of its FX reserve holdings and keeping rates higher than the rest of the developed world—even though the UK economy was underperforming. In both 1961 and 1964, the pound came under intense selling pressure, and the peg was only maintained by a sharp rise in rates, a rapid acceleration in reserve sales, and the extension of short-term credits from the US and the Bank of International Settlements. By 1966, attempts to defend the peg were being described by prominent British policy makers as “a sort of British Dien Bien Phu.”[61]  When the pound came under extreme selling pressure again in 1967 (following rising rates in the developed world, recessions in major UK export markets, and heightened conflict in the Middle East),[62] British policy makers decided to devalue sterling by 14% against the dollar.No alt text provided for this image
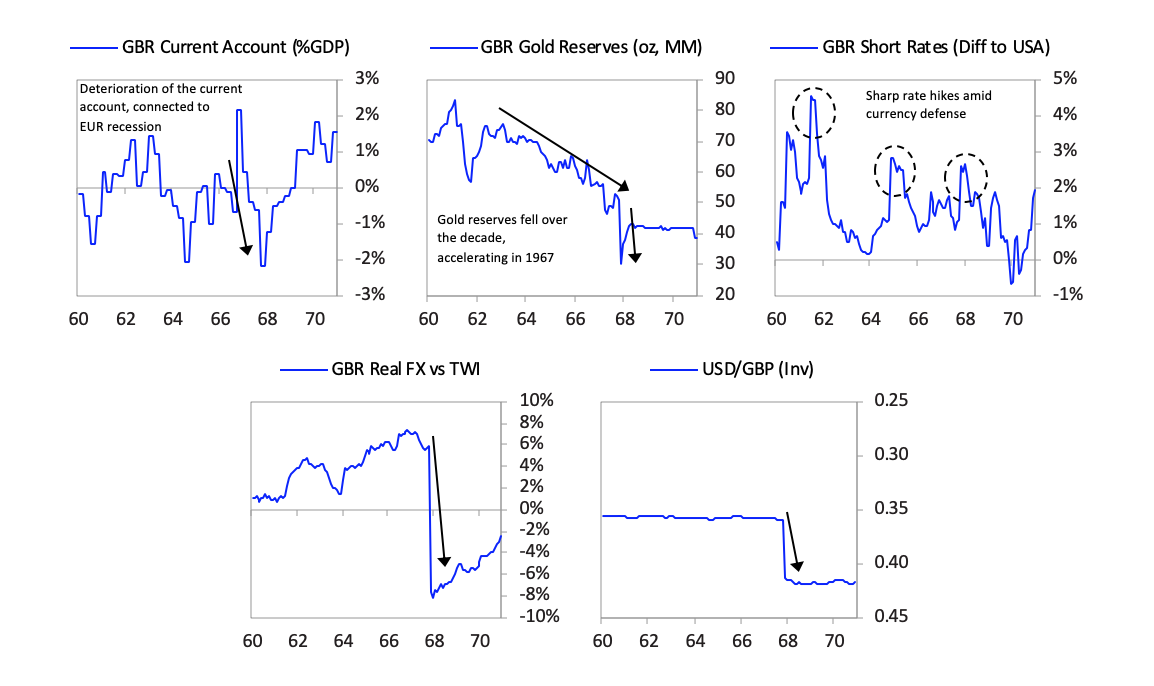
After the devaluation little faith remained in the pound as the second-best reserve currency after the dollar. For the first time since the end of World War II, international central banks began actively selling their sterling reserves (as opposed to simply accumulating fewer pounds in new reserve holdings) and instead began buying dollars, deutschmarks, and yen. As you can see in the chart below on the left, the average share of sterling in central bank reserve holdings collapsed within two years of the devaluation.  At the same time the UK was still able to convince Sterling Area countries not to diversify away from the pound. In the Sterling Agreement of 1968, Sterling Area members agreed to maintain a floor on their pound reserve holdings, as long as 90% of the dollar value of these holdings was guaranteed by the British government. So although the share of pound reserves in these Sterling Agreement countries like Australia and New Zealand remained high, this was only because these reserves had their value guaranteed by the British in dollars. So all countries that continued to hold a high share of their reserves in pounds after 1968 were holding de facto dollars with the British bearing the risk of a further sterling devaluation.[63]No alt text provided for this image
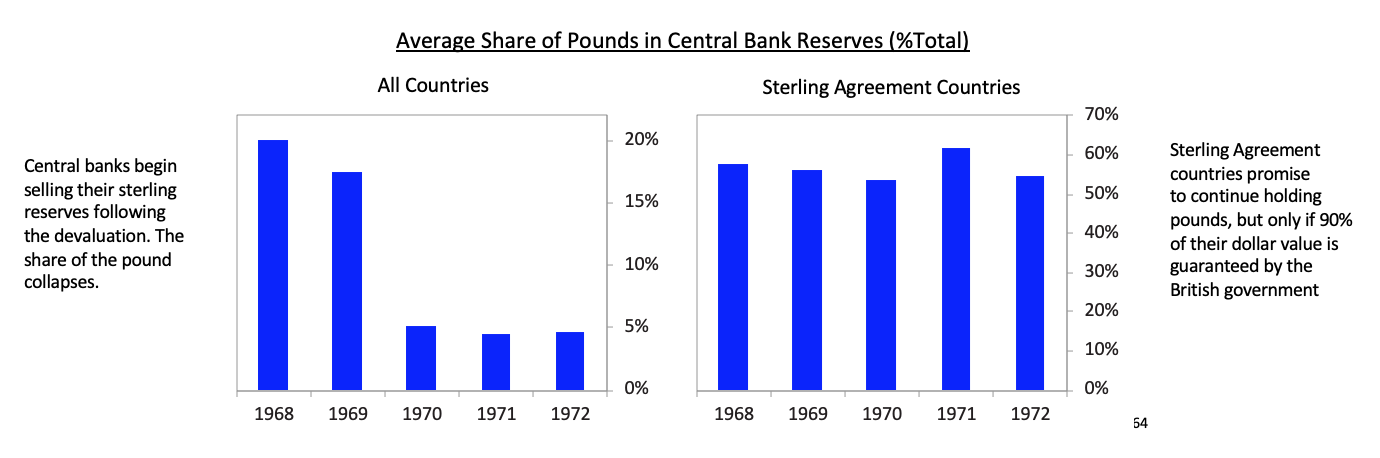
[64]By this time the dollar was having its own set of balance of payments and currency problems, but that is for the next installment of this series when I turn to the United States and China.  [1] We show where key indicators were relative to their history by averaging them across the cases. The chart is shown such that a value of “1” represents the peak in that indicator relative to history and “0” represents the trough.  The timeline is shown in years with “0” representing roughly when the country was at its peak (i.e., when the average across gauges was at its peak).  In the rest of this section, we walk through each of the stages of the archetype in more detail. While the charts show the countries that produced global reserve currencies, we’ll also heavily reference China, which was a dominant empire for centuries, though it never established a reserve currency.[2] A good example of this is the popularity of the Patriot movement in the Netherlands around this time: Encyclopedia Britannica, The Patriot movement,  https://www.britannica.com/place/Netherlands/The-18th-century#ref414139[3] While most people think that the ascent of the US came after World War II, it really started here and went on across both wars—and the seeds of that rise came still earlier from the self-reinforcing upswings in US education, innovation, competitiveness, and economic outcomes over the 19th century.[4] Rough estimate based on internal calculations[5] Rough estimate based on internal calculations[6] Rough estimate based on internal calculations[7] In this piece, when talking about “the guilder,” we generally refer to guilder bank notes, which were used at the Bank of Amsterdam, rather than the physical coin (also called “guilder”).[8] Encyclopedia Britannica, Eighty Years’ War, https://www.britannica.com/event/Eighty-Years-War[9] Encyclopedia Britannica, The Anglo-Dutch Wars, https://www.britannica.com/event/Anglo-Dutch-Wars[10] Israel, Dutch Primacy in World Trade, 1585-1740, 219[11] Encyclopedia Britannica, The Anglo-Dutch Wars, https://www.britannica.com/event/Anglo-Dutch-Wars[12] Encyclopedia Britannica, The Dutch War, https://www.britannica.com/event/Dutch-War[13] Israel, The Dutch Republic: Its Rise, Greatness, and Fall 1477-1806, 824-825[14] Encyclopedia Britannica, The Anglo-Dutch Wars, https://www.britannica.com/event/Anglo-Dutch-Wars[15] There was a general rise in foreign investment by the Dutch during this period. Investments in UK assets offered high real returns. Examples include Dutch purchases of stocks in the British East India Company, and the City of London selling term annuities (bonds) to Dutch investors. For a further description, see Hart, Jonker, and van Zanden, A Financial History of the Netherlands, 56-58.[16] Hart, Jonker, and van Zanden, A Financial History of the Netherlands, 20-21[17] Quinn & Roberds, “Death of a Reserve Currency,” 13  [18] Encyclopedia Britannica, The Anglo-Dutch Wars, https://www.britannica.com/event/Anglo-Dutch-Wars[19] Encyclopedia Britannica, The Anglo-Dutch Wars, https://www.britannica.com/event/Anglo-Dutch-Wars[20] Encyclopedia Britannica, The Anglo-Dutch Wars, https://www.britannica.com/event/Anglo-Dutch-Wars[21] de Vries & van der Woude, The First Modern Economy, 455[22] de Vries & van der Woude, The First Modern Economy, 126[23] de Vries & van der Woude, The First Modern Economy, 685-686[24] de Vries & van der Woude, The First Modern Economy, 455[25] de Vries & van der Woude, The First Modern Economy, 455-456 & https://www.britannica.com/event/Anglo-Dutch-Wars[26] This chart only shows the financial results from the Dutch East India Company reported “in patria,” e.g., the Netherlands. It does not include the part of the revenue and debt from its operations in Asia but does include its revenues from goods it retrieved in Asia and sold in Europe.[27] Quinn & Roberds, “Death of a Reserve Currency,” 17[28] “Guilder” in this case refers to devaluing bank deposits in guilder from the Bank of Amsterdam, not physical coin. For details on the run, see Quinn & Roberds, “Death of a Reserve Currency,” 16.[29] Quinn & Roberds, “Death of a Reserve Currency,” 17-18[30] Quinn & Roberds, “Death of a Reserve Currency,” 16[31] Quinn & Roberds, “Death of a Reserve Currency,” 34[32] Quinn & Roberds, “Death of a Reserve Currency,” 15-16[33] The Bank of Amsterdam was ahead its time and used ledgers instead of real “paper money.” See Quinn & Roberds, “The Bank of Amsterdam Through the Lens of Monetary Competition,” 2[34] Quinn & Roberds, “Death of a Reserve Currency,” 19, 26[35] Quinn & Roberds, “Death of a Reserve Currency,” 19-20[36] Quinn & Roberds, “Death of a Reserve Currency,” 16[37] Quinn & Roberds, “Death of a Reserve Currency,” 24[38] de Vries & van der Woude, The First Modern Economy, 685-686[39] Encyclopedia Britannica, The Dutch East India Company, https://www.britannica.com/topic/Dutch-East-India-Company; also see de Vries & van der Woude, The First Modern Economy, 463-464[40] Historical data suggests that by 1795, bank deposits were trading at a -25% discount to actual coin. Quinn & Roberds, “Death of a Reserve Currency,” 26.[41] Note: To fully represent the likely economics of a deposit holder at the Bank of Amsterdam, we assumed depositors each received their pro-rated share of precious metal still in the bank’s vaults when it was closed (that was roughly 20% of the fully backed amount, thus the approximately 80% total devaluation).[42] Gelderblom & Jonker, “Exporing the Market for Government Bonds in the Dutch Republic (1600-1800),” 16[43] For example, see Catherine Schenk, The Decline of Sterling: Managing the Retreat of an International Currency, 1945–1992, 37 (hereafter referred to as Schenk, Decline of Sterling)[44] See Schenk, Decline of Sterling, 39[45] For an overview of the convertibility crisis and devaluation, see Schenk, Decline of Sterling, 68-80; Alec Cairncross & Barry Eichengreen, Sterling in Decline: The Devaluations of 1931, 1949, and 1967, 102-147 (hereafter referred to as Cairncross & Eichengreen, Sterling in Decline).[46] Schenk, Decline of Sterling, 44[47] Schenk, Decline of Sterling, 31[48] Alex Cairncross, Years of Recovery: British Economic Policy 1945-51, 124-126[49] Schenk, Decline of Sterling, 63[50] Schenk, Decline of Sterling, 48[51] Schenk, Decline of Sterling, 62[52] As quoted in Schenk, Decline of Sterling, 62-63[53] Ibid[54] Schenk, Decline of Sterling, 66-67[55] For more detail, see Cairncross & Eichengreen, Sterling in Decline, 139-155[56] See also Cairncross & Eichengreen, Sterling in Decline, 151-155 for a discussion of other contributing factors[57] Schenk, Decline of Sterling, 39, 46; for further description, see https://eh.net/encyclopedia/the-sterling-area/[58] For further description of these and other coordinated policies, see Catherine Schenk, “The Retirement of Sterling as a Reserve Currency After 1945: Lessons for the US Dollar?”[59] John Singleton & Catherine Schenk, “The Shift from Sterling to the Dollar, 1965–76: Evidence from Australia and New Zealand,” 1162[60] For more detail on the dynamics of the Sterling Area, see Catherine Schenk, Britain and the Sterling Area, 1994[61] As quoted by Schenk, Decline of Sterling, 156[62] Schenk, Decline of Sterling, 174[63] For fuller coverage of this, see Schenk, Decline of Sterling, 273-315[64] Data from Schenk, “The Retirement of Sterling as a Reserve Currency After 1945: Lessons for the US Dollar?,” 25DisclosuresBridgewater Daily Observations is prepared by and is the property of Bridgewater Associates, LP and is circulated for informational and educational purposes only.  There is no consideration given to the specific investment needs, objectives or tolerances of any of the recipients.  Additionally, Bridgewater’s actual investment positions may, and often will, vary from its conclusions discussed herein based on any number of factors, such as client investment restrictions, portfolio rebalancing and transactions costs, among others.  Recipients should consult their own advisors, including tax advisors, before making any investment decision.  This report is not an offer to sell or the solicitation of an offer to buy the securities or other instruments mentioned.Bridgewater research utilizes data and information from public, private and internal sources, including data from actual Bridgewater trades. Sources include the Australian Bureau of Statistics, Bloomberg Finance L.P., Capital Economics, CBRE, Inc., CEIC Data Company Ltd., Consensus Economics Inc., Corelogic, Inc., CoStar Realty Information, Inc., CreditSights, Inc., Dealogic LLC, DTCC Data Repository (U.S.), LLC, Ecoanalitica, EPFR Global, Eurasia Group Ltd., European Money Markets Institute – EMMI, Evercore ISI, Factset Research Systems, Inc., The Financial Times Limited, GaveKal Research Ltd., Global Financial Data, Inc., Haver Analytics, Inc., ICE Data Derivatives, IHSMarkit, The Investment Funds Institute of Canada, International Energy Agency, Lombard Street Research, Mergent, Inc., Metals Focus Ltd, Moody’s Analytics, Inc., MSCI, Inc., National Bureau of Economic Research, Organisation for Economic Cooperation and Development, Pensions & Investments Research Center, Renwood Realtytrac, LLC, Rystad Energy, Inc., S&P Global Market Intelligence Inc., Sentix Gmbh, Spears & Associates, Inc., State Street Bank and Trust Company, Sun Hung Kai Financial (UK), Refinitiv, Totem Macro, United Nations, US Department of Commerce, Wind Information (Shanghai) Co Ltd, Wood Mackenzie Limited, World Bureau of Metal Statistics, and World Economic Forum.  While we consider information from external sources to be reliable, we do not assume responsibility for its accuracy.The views expressed herein are solely those of Bridgewater as of the date of this report and are subject to change without notice.  Bridgewater may have a significant financial interest in one or more of the positions and/or securities or derivatives discussed.  Those responsible for preparing this report receive compensation based upon various factors, including, among other things, the quality of their work and firm revenues.


Posted in Most Recent | Leave a comment

How does the “Bravo Microbiome” balance our need for GcMAF without the natural signals which are behind the biofilm?

Dr. Ruggiero answered:

An independent laboratory (R.E.D. Labs, Belgium) demonstrated that Bravo products have 100 fold more GcMAF activity against nagalase than purified GcMAF. These results have been published in a peer-reviewed scientific article where the effects of Bravo on nagalase and on C-Reactive Protein – a marker of systemic inflammation – are described. The article can be downloaded at 

https://thescipub.com/abstract/10.3844/ajisp.2020.8.18

Experimental data obtained in vitro and presented in Figs. 5 and 6 of the article demonstrate the GcMAF activity that is present in Bravo. Since it is well assessed that nagalase specifically binds GcMAF, formation of complexes between nagalase and Bravo is direct demonstration of the presence of active GcMAF in PMF as we described since 2011. Figs. 5 and 6 of the article show the kinetics of in vitro interaction between human nagalase and Bravo with resulting formation of nagalase/Bravo complexes. Bravo at 1:100 dilution had an initial value (at time 0) higher than that observed with PBS alone, thus demonstrating the presence of immediate, intrinsic GcMAF activity. At every time point, Bravo showed significantly higher activity in comparison with purified GcMAF and, at 120 h, the GcMAF activity of Bravo was still well above baseline, whereas purified GcMAF did not show any residual activity (Fig. 7 of the article). Therefore, it may be deduced that the GcMAF activity in Bravo is more than 100 fold higher than that of purified GcMAF and more sustained in time. The 100 fold higher activity of Bravo in comparison with purified GcMAF can be explained taking into consideration two elements. 

1. Naturally formed GcMAF in Bravo is associated with vitamin D3, fatty acids and glycosaminoglycans – such as chondroitin sulfate – that are normal constituents of milk and colostrum. Since 2013, we proposed a molecular model describing how non-covalent association of these constituents in a multi-molecular complex significantly enhanced the biological activity of GcMAF. This model was independently confirmed by a recent study demonstrating that association with vitamin D3 significantly increased the immune stimulating activity of GcMAF (Greilberger and Herwig, 2020).

2.  Phages in Bravo synthesize proteins with activities superimposable to that of GcMAF that complement the effects of the naturally formed GcMAF that is present in Bravo. For example, the protein RAD52 that is the human homolog of the protein Sak encoded by Lactococcus phage ul36, shows significant similarity with the active site of GcMAF. When the sequences of human RAD52 (P43351) and GcMAF (P02774) were obtained and aligned using the Align tool of Uniprot, alignment showed a striking similarity between the active site of GcMAF that is the sequence TPTELAK, and the sequence DPAQTSD of RAD52. Since it is well known that phages stimulate the immune system, and it is also known that such a stimulation is associated with macrophage activation, see our article at

https://www.biorxiv.org/content/10.1101/714154v3

it is may be hypothesized that GcMAF-like proteins encoded by phages contribute to the overall GcMAF activity of Bravo.

As far as biofilms are concerned, GcMAF in Bravo is not affected by biofilms since the probiotic microbes that are part of Bravo have been selected so to break biofilms as demonstrated by the following scientific article

https://www.ncbi.nlm.nih.gov/pmc/articles/PMC7049744/

In other words, at variance with regular GcMAF, whose action can be blocked by biofilms, the GcMAF in Bravo, not only is 100 fold more potent, but it is also unaffected by biofilms since the enzymes released by the probiotics of Bravo break the biofilms.

The composition in microbes, phages and plasmids in Bravo has been described in the following scientific articles

https://www.biorxiv.org/content/10.1101/714154v3

https://madridge.org/journal-of-immunology/mjim-1000123.pdf

Finally, the anti-viral activity of Bravo has been clinically demonstrated; the evidence is in the insert of Fig. 4 of this article

https://www.biorxiv.org/content/10.1101/2020.03.03.975524v1.full.pdf+html

where the viral load goes down by 98% in a few weeks.

Posted in Most Recent | 1 Comment

Bravo Edestiny Boot Camp

This is an educational compilation for Dr. Ruggiero’s product called Edestiny. It was introduced on 3/31/2020.

The following items are about Bravo Edestiny:

Mimi requests any information that you may have that is not on this page. Send the information to mimi@bravocoop.com

Posted in Most Recent | 67 Comments

Bravo Edestiny: Hemp Seed Protein and Bravo Cultures

From Dr. Marco Ruggiero:

BRAVO EDESTINY (CAPSULES) is a product entirely made in Switzerland and contains exclusively ingredients from certified Swiss and European sources; all the microorganisms, probiotic strains, and ingredients in this product are certified safe for human use. They are manufactured exclusively for our Swiss company by state-of-the-art GMP-certified European facilities that guarantee the highest quality. 

In our Swiss facility we choose the best Swiss quality hemp seed protein powder, we blend it with highly selected food ingredients (such as real lemon juice and apple cider vinegar), we add our proprietary blend of fermenting cultures, our array of probiotics and prebiotics, and we leave the product to fully and naturally ferment following our proprietary process. Then, after full and extensive fermentation, we freeze dry the product and we make it available under the form of gastro-resistant (enteric-coated), vegetable, capsules. 

To purchase Bravo Edestiny click here

THE LATEST BREAKTHROUGH FROM BRAVO RESEARCH

I am pleased to announce BRAVO EDESTINY, a completely new product that joins our Bravo family and, just like the other products, it is absolutely unique.  Bravo Edestiny is based on fermentation of hemp seed proteins by the proprietary array of probiotic microbes that are at the core of all Bravo products.  The two major proteins of hemp are Edestin – hence the name Edestiny – and Albumin.

Edestin has the unique ability to stimulate the body’s immunological responses against invasive agents [1]; fermentation of edestin by Bravo microbes leads to formation of a vegetal analogue of GcMAF and makes Bravo Edestiny the only probiotic with active vegetable based GcMAF. Bravo Edestiny comes in the wake of scientific results demonstrating that it has GcMAF activity 100 fold higher than that of purified GcMAF and lowers nagalase [2 3]. 

Albumin, the other protein in Bravo Edestiny, is known to inhibit viral entry into human cells, boost immune responses and attenuate DNA damage [4 5 6].

Some of the properties of fermented Edestin and Albumin are mentioned in my latest talk for Sophia Health Institute, [see here] from min 45. 

To purchase Bravo Edestiny click here

Posted in Most Recent | 7,337 Comments

Bravo European Instructions


Posted in Most Recent | 4,419 Comments

Research from a talk given by Dr. Marco Ruggiero

Furin, a potential therapeutic target for COVID-19 

Potential treatment of Chinese and Western Medicine targeting nsp14 of 2019-nCoV 

Clinical remission of a critically ill COVID-19 patient treated by human umbilical cord mesenchymal stem cells 

Transplantation of ACE2- mesenchymal stem cells improves the outcome of patients with COVID-19 pneumonia 

Uncanny similarity of unique inserts in the 2019-nCoV spike protein to HIV-1 gp120 and Gag 

Decoding the evolution and transmissions of the novel pneumonia coronavirus (SARS-CoV-2) using whole genomic data 

Posted in Most Recent | Leave a comment

Transplantation of ACE2- mesenchymal stem cells improves the outcome of patients with COVID-19 pneumonia

Transplantation of ACE2– mesenchymal stem cells improves the outcome of patients with COVID-19 pneumonia

Zikuan Leng1,5#, Rongjia Zhu2#, Wei Hou3#, Yingmei Feng3#, Yanlei Yang4, Qin Han2, Guangliang Shan2, Fanyan Meng1, Dongsheng Du1, Shihua Wang2, Junfen Fan2, Wenjing Wang3, Luchan Deng2, Hongbo Shi3, Hongjun Li3, Zhongjie Hu3, Fengchun Zhang4, Jinming Gao4, Hongjian Liu5*, Xiaoxia Li6, Yangyang Zhao2, Kan Yin6, Xijing He7, Zhengchao Gao7, Yibin Wang7, Bo Yang8, Ronghua Jin3*, Ilia Stambler9,10,11, Kunlin Jin9,10,12*, Lee Wei Lim9,10,13, Huanxing Su9,10,14, Alexey Moskalev9,10,15, Antonio Cano9,10,16, Sasanka Chakrabarti9,10,17, Armand Keating9.10,18, Kyung-Jin Min9,10,19, Georgina Ellison-Hughes9,10,20, Calogero Caruso9,10,21, Robert Chunhua Zhao1,2,9,10*

1School of Life Sciences, Shanghai University, Shanghai, 200444, China
2Institute of Basic Medical Sciences Chinese Academy of Medical Sciences, School of Basic Medicine Peking Union Medical College, Beijing, 100005, China
3Beijing You’an Hospital, Capital Medical University, Beijing, China
4Department of Medicine, Peking Union Medical College Hospital, Chinese Academy of Medical Sciences and Peking Union Medical College, Beijing, China
5Department of Orthopaedics, the First Affiliated Hospital of Zhengzhou University, Zhengzhou, China
6Institute of Stem Cell and Regeneration Medicine, School of Basic Medicine, Qingdao University, Qingdao, Shandong, China
7Department of Orthopaedics, the Second Affiliated Hospital of Xi’an Jiaotong University, Xi’an, China
8Department of Neurosurgery, the First Affiliated Hospital of Zhengzhou University, Zhengzhou, China
9The Executive Committee on Anti-aging and Disease Prevention in the framework of Science and Technology, Pharmacology and Medicine Themes under an Interactive Atlas along the Silk Roads, UNESCO, Paris, France
10International Society on Aging and Disease (ISOAD), Fort Worth, Texas, USA
11The Geriatric Medical Center “Shmuel Harofe”, Beer Yaakov, affiliated to Sackler School of Medicine, Tel-Aviv University, Tel-Aviv, Israel
12University of North Texas Health Science Center, Fort Worth, TX, USA
13School of Biomedical Sciences, Li Ka Shing Faculty of Medicine, University of Hong Kong, Hong Kong, China
14Institute of Chinese Medical Science, University of Macau, Taipa, Macau, China 15Laboratory of Geroprotective and Radioprotective Technologies,
Institute of Biology, Komi Science Center of Russian Academy of Sciences, Syktyvkar, Russia 16Department of Pediatrics, Obstetrics and Gynecology, University of Valencia, Valencia, Spain 17Department of Biochemistry, Maharishi Markandeshwar University, Kolkata, India

page1image63278080

1

chinaXiv:202002.00080v1

18Institute of Medical Science, University of Toronto, Toronto, Canada
19Department of Biological Sciences, Inha University, Incheon, South Korea
20Centre of Human & Aerospace Physiological Sciences & Centre for Stem Cells and Regenerative Medicine, Faculty of Life Sciences & Medicine, King’s College London, London, UK
21Laboratory of Immunopathology and Immunosenescence, Department of Biomedicine, Neuroscience and Advanced Diagnostics, University of Palermo, Palermo, Italy

#These authors contributed equally to this work

*Corresponding authors:
Robert Chunhua Zhao, M.D. & Ph.D., Professor, School of Life Sciences, Shanghai University, Shanghai 200444, China. Email: zhaochunhua@vip.163.com

Kunlin Jin, M.D. & Ph.D., Professor, University of North Texas Health Science Center, Fort Worth, TX, 76107, USA. kunlin.Jin@unthsc.edu

Ronghua Jin, M.D. & Ph.D., Professor, You’an Hospital, Capital Medical University, Beijing, China. Email: jin_eagle@sina.com

Hongjian Liu, M.D. & Ph.D., Professor, Department of Orthopaedics, the First Affiliated Hospital of Zhengzhou University, Zhengzhou, China. Email: hongjianmd@126.com

page2image63277888
page2image63277312

2

chinaXiv:202002.00080v1

Abstract

A coronavirus (HCoV-19) has caused the novel coronavirus disease (COVID-19) outbreak in Wuhan, China, Preventing and reversing the cytokine storm may be the key to save the patients with severe COVID-19 pneumonia. Mesenchymal stem cells (MSCs) have been shown to possess a comprehensive powerful immunomodulatory function. This study aims to investigate whether MSC transplantation improve the outcome of 7 enrolled patients with COVID-19 pneumonia in Beijing YouAn Hospital, China from Jan 23, 2020. to Feb 16, 2020. The clinical outcomes, as well as changes of inflammatory and immune function levels and adverse effects of 7 enrolled patients were assessed for 14 days after MSC injection. MSCs could cure or significantly improve the functional outcomes of seven patients with COVID-19 pneumonia in 14 days without observed adverse effect. The pulmonary function and symptoms of all patients with COVID-19 pneumonia were significantly improved in 2 days after MSC transplantation. Among them, two common and one severe patient were recovered and discharged in 10 days after treatment. After treatment, the peripheral lymphocytes were increased and the overactivated cytokine-secreting immune cells CXCR3+CD4+ T cells, CXCR3+CD8+ T cells, and CXCR3+ NK cells were disappeared in 3-6 days. And a group of CD14+CD11c+CD11bmid regulatory DC cell population dramatically increased. Meanwhile, the level TNF-α is significantly decreased while IL-10 increased in MSC treatment group compared to the placebo control group. Furthermore, the gene expression profile showed MSCs were ACE2- and TMPRSS2- which indicated MSCs are free from COVID-19 infection. Thus, the intravenous transplantation of MSCs was safe and effective for treatment in patients with COVID-19 pneumonia, especially for the patients in critically severe condition.

Key words

COVID-19, ACE2 negative, mesenchymal stem cells, cell transplantation, immunomodulatory, function recovery

Introduction

The novel coronavirus disease 2019 (COVID-19) has grown to be a global public health emergency since patients were first detected in Wuhan, China, in December 2019. Since then, the number of COVID-19 confirmed patients have sharply increased not only in China, but also worldwide, including Germany, South Korea, Vietnam, Singapore, and USA[1]. Currently, no specific drugs or vaccines are available to cure the patients with COVID-19 infection. Hence, there is a large unmet need for a safe and effective treatment for COVID-19 infected patients, especially the severe cases.

Several reports demonstrated that the first step of the HCoV-19 pathogenesis is that the virus specifically recognizes the angiotensin I converting enzyme 2 receptor (ACE2) by its spike protein[2-4]. ACE2-positive cells are infected by the HCoV-19, like SARS-2003[5,6]. In addition, a research team from Germany revealed that the cellular serine protease TMPRSS2 for HCoV-19 Spike protein priming is also essential for the host cell entry and spread[7], like

3

chinaXiv:202002.00080v1

the other coronavirus (i.e. SARS-2003)[8,9]. Unfortunately, the ACE2 receptor is widely distributed on the human cells surface, especially the alveolar type II cells (AT2) and capillary endothelium[10], and the AT2 cells highly express TMPRSS2[9]. However, in the bone marrow, lymph nodes, thymus, and the spleen, immune cells, such as T and B lymphocytes, and macrophages are consistently negative for ACE2[10]. The findings suggest that immunological therapy may be used to treat the infected patients. However, the immunomodulatory capacity may be not strong enough, if only one or two immune factors were used, as the virus can stimulate a terrible cytokine storm in the lung, such as IL-2, IL-6, IL-7, GSCF, IP10, MCP1, MIP1A, and TNFα, followed by the edema, dysfunction of the air exchange, acute respiratory distress syndrome, acute cardiac injury and the secondary infection[11], which may led to death. Therefore, avoiding the cytokine storm may be the key for the treatment of HCoV-19 infected patients. MSCs, owing to their powerful immunomodulatory ability, may have beneficial effects on preventing or attenuating the cytokine storm.

MSCs have been widely used in cell-based therapy, from basic research to clinical trials[12,13]. Safety and effectiveness have been clearly documented in many clinical trials, especially in the immune-mediated inflammatory diseases, such as graft versus-host disease (GVHD)[14] and systemic lypus erythematosus (SLE)[15]. MSCs play a positive role mainly in two ways, namely immunomodulatory effects and differentiation abilities[16]. MSCs can secrete many types of cytokines by paracrine secretion or make direct interactions with immune cells, leading to immunomodulation[17]. The immunomodulatory effects of MSCs are triggered further by the activation of TLR receptor in MSCs, which is stimulated by pathogen-associated molecules such as LPS or double-stranded RNA from virus[18,19], like the HCoV-19.

Here we conducted an MSC transplantation pilot study to explore their therapeutic potential for HCoV-19 infected patients. In addition, we also explored the underlying mechanisms using a 10× Genomics high throughput RNA sequencing clustering analysis on MSCs and mass cytometry.

Materials and Methods
Study design
A pilot trial of intravenous MSC transplantation was performed on seven patients with COVID-19 infected pneumonia. The study was conducted in Beijing YouAn Hospital, Capital Medical University, China, and approved by the ethics committee of the hospital (LL-2020- 013-K). The safety and scientific validity of this study “Clinical trials of mesenchymal stem cells for the treatment of pneumonitis caused by novel coronavirus” from Shanghai University/ PUMC have been reviewed by the scientific committee at International Society on Aging and Disease (ISOAD) and issued in Chinese Clinical Trial Registry (ChiCTR2000029990).
The Patients
The patients were enrolled from Jan 23, 2020 to Jan 31, 2020. All enrolled patients were

4

chinaXiv:202002.00080v1

confirmed by the real-time reverse transcription polymerase chain reaction (RT-PCR) assay of HCoV-19 RNA in Chinese Center for Disease Control and Prevention using the protocol as described previously[11,20]. The sequences were as follows: forward primer 5′-

TCAGAATGCCAATCTCCCCAAC-3′; reverse AAAGGTCCACCCGATACATTGA-3′; andCTAGTTACACTAGCCATCCTTACTGC-3′BHQ1.
We initially enrolled patients with COVID-19 (age 18–95 years) according to the guidance of National Health and Health Commission of China (Table 1).

If no improvement signs were observed under the standard treatments, the patient would be suggested to receive the MSC transplantation. Patients were ineligible if they had been diagnosed with any kind of cancers or the doctor declared the situation to belong to the critically severe condition. We excluded patients who were participating in other clinical trials or who have participated in other clinical trials within 3 months.

Cell preparation and transplantation

The clinical grade MSCs were supplied, for free, by Shanghai University, Qingdao Co-orient Watson Biotechnology group co. LTD and the Institute of Basic Medical Sciences, Chinese Academy of Medical Sciences. The cell product has been certified by the National Institutes for Food and Drug Control of China (authorization number: 2004L04792,2006L01037,CXSB1900004). Before the intravenous drip, MSCs were suspended in 100 ml of normal saline, and the total number of transplanted cells was calculated by 1 × 10⁶ cells per kilogram of weight. The window period for cell transplantation was defined as the time when symptoms or/and signs still were getting worse even as the expectant treatments were being conducted. The injection was performed about forty minutes with a speed of ~40 drops per minute.

The patients were assessed by the investigators through the 14-day observation after receiving the investigational product. The clinical, laboratory, and radiological outcomes were recorded and certified by a trained group of doctors. The detailed record included primary safety data (infusional and allergic reactions, secondary infection and life-threatening adverse events) and the primary efficacy data (the level of the cytokines variation, the level of C-reactive protein in plasma and the oxygen saturation). The secondary efficacy outcomes mainly included the total lymphocyte count and subpopulations, the chest CT, the respiratory rate, and the patient symptoms (especially the fever and shortness of breath). In addition, the therapeutic measures (i.e. antiviral medicine and respiratory support) and outcomes were also examined.

Statistical analysis

MIMICS 21.0 (Interactive medical image control system of Materialise, Belgium) was used to evaluate the chest CT data. The analysis of Mass cytometry of the peripheral blood mononuclear cells is described in Supplementary Material 1. The analysis of the 10 x RNA-seq survey is described in Supplementary Material 2. Data were analyzed by SPSS software (SPSS 22.0). Differences between two groups were assessed using unpaired two-tailed t tests. Data

5

primer 5′- the probe 5′CY5-

chinaXiv:202002.00080v1

involving more than two groups were assessed by analysis of variance (ANOVA). P values <0.05 indicated statistical significance.

Results
MSC treatment procedure and general patient information
This study was conducted from Jan 23, 2020, to Feb 16, 2020. Seven confirmed COVID-19 patients, including 1 critically severe type (patient 1), 4 severe types (patient 2, 3, 6, 7) and 2 common types (patient 4, 6) were enrolled. The timepoint of MSC transplantation for each patient is as shown in Figure 1. The general information of the 7 patients is listed in Table 1. Hitherto, the critically severe patient had completed the MSC treatment. This patient had a 10- year medical history of hypertension with the highest-level of 180/90 mmHg recorded. All the treatment information of the patients was collected.

Figure 1. The flow chart of the cell transplantation treatment

The primary safety outcome

Before the MSC transplantation, the patients had symptoms of high fever (38.5°C ± 0.5°C), weakness, shortness of breath, and low oxygen saturation. However, 2~4 days after transplantation, all the symptoms were disappeared in all the patients, the oxygen saturations rose to ≥ 95% at rest, without or with oxygen uptake (5 liters per minute). In addition, no acute infusion-related or allergic reactions were observed within two hours after transplantation. Similarly, no delayed hypersensitivity or secondary infections were detected after treatment. The detailed diagnosis and treatment procedures of the critically severe patient are shown in Supplementary Material 3. The main symptoms and signs are shown in Table 3.

page6image63990544

6

chinaXiv:202002.00080v1

The efficacy outcome

The immunomodulating function of MSCs contributed to the main efficacy outcome and the transplantation of MSCs showed impressive positive results (Table 3). For the primary outcome in the critically severe patient 1, the plasma C-reaction protein level decreased from 105.5 g/L (Jan 30) to 10.1 g/L (Feb 13), which reached the highest level of 191.0 g/L on Feb 1, indicating that the inflammation status was alleviating quickly. The oxygen saturation, without Supplementary oxygen, rose from 89% (Jan 31) to 98% (Feb 13), which indicated the pulmonary alveoli regained the air-change function.

The secondary outcomes were also improved (Table 4). Considering, for example, the critically severe patient 1, the lymphopenia was significantly improved after the cell transplantation. The patient was isolated in the hospital isolation ward with a history of hypertension and blood pressure reaching grade 3 hypertension. On Feb 1, biochemical indicators in the blood test showed that aspartic aminotransferase, creatine kinase activity and myoglobin increased sharply to 57 U/L, 513 U/L, and 138 ng/ml, respectively, indicating severe damage to the liver and myocardium. However, the levels of these functional biochemical indicators were decreased to normal reference values in 2~4 days after treatment (Table 4). On February 13, all the indexes reached to normal levels, namely 19 U/L, 40 U/L, and 43 ng/ml, respectively. The respiratory rate was decreased to the normal range on the 4th day after MSC transplantation. Both fever and shortness of breath disappeared on the 4th day after MSCs transplantation. Chest CT imaging showed that the ground-glass opacity and pneumonia infiltration had largely reduced on the 9th day after MSC transplantation (Figure 2).

7

chinaXiv:202002.00080v1

page8image64007344

Figure 2. Chest computerized tomography (CT) images of the critically severe COVID-19 patient. On Jan 23, no pneumonia performance was observed. On Jan 30, ground-glass opacity and pneumonia infiltration occurred in multi-lobes of the double sides. Cell transplantation was performed on Jan 31. On Feb 2, the pneumonia invaded all through the whole lung. On Feb 9, the pneumonia infiltration faded away very much. On Feb 15, only little ground-glass opacity was residual in local.

8

chinaXiv:202002.00080v1

HCoV-19 nucleic acid detection

RT-PCR analysis of HCoV-19 nucleic acid was performed before and after MSC transplantation. For the critically severe patient, before transplantation (Jan 23) and 6 days after transplantation (Feb 6), HCoV-19 nucleic acid was positive. 13 days after transplantation (Feb 13), HCoV-19 nucleic acid turned to be negative. The patient 3, 4,5 also turned to be negative result of HCoV- 19 nucleic acid until this report date.

Mass cytometry (CyTOF) analysis of the patients’ peripheral blood

To investigate the profile of the immune system constitution during MSC transplantation, we performed the CyTOF to analyze immune cells in the patients’ peripheral blood before and after transplantation. CyTOF revealed that there was nearly no increase of regulatory T cells (CXCR3-) or dendritic cells (DC, CXCR3-) for the two patients of common type (Patient 4 and 5). But in the severe patients, both the regulatory T cells and DC increased after the cell therapy, especially for the critically severe patient. Notably, no significant CXCR3- DC enhanced after placebo treatment in three severe control patients. Moreover, for the critically severe patient, before the MSC transplantation the percentage of CXCR3+CD4+ T cells, CXCR3+CD8+ T cells, and CXCR3+ NK cells in the patient’s PBMC were remarkably increased compared to the healthy control, which caused the inflammatory cytokine storm. However, 6 days after MSC transplantation, the overactivated T cells and NK cells nearly disappeared and the numbers of the other cell subpopulations were almost restored to the normal levels, especially the CD14+CD11c+CD11bmid regulatory dendritic cell population (Figure 3).

9

chinaXiv:202002.00080v1

page10image64075792

Figure 3. The mass cytometry results of peripheral blood mononuclear cells of the enrolled patients (A, B) and the critically severe patient (C). No increase of regulatory T cells (CXCR3-) or dendritic cells (DC, CXCR3-) for the two patients of common type (Patient 4 and 5, Figrue 3A). But in the severe patients, both the regulatory T cells and DC increased after the cell therapy, especially for the critical severe patient 1 (Figure 3B). Moreover, for the critically severe patient 1, before the MSC transplantation the percentage of overactivated CXCR3+CD4+ T cells (#9), CXCR3+CD8+ T cells (#17), and CXCR3+ NK cells (#12) in the patient’s PBMC were remarkably increased compared to the healthy control (Figure 3C). However, 6 days after MSC transplantation, the overactivated T cells and NK cells nearly disappeared and the numbers of the other cell subsets were almost reversed to the normal levels, especially the CD14+CD11c+CD11bmid DC (#20) population. Normal: health individuals, MSCs: mesenchymal stem cells transplant group, Ctrl: placebo control group.

Serum Cytokine/Chemokine/Growth Factor Analysis

After intravenous injection of MSCs, the decrease ratio of pro-inflammatory cytokine in serum TNF-α before and after MSC treatment was significant (p<0.05). Meanwhile, the increase ratio of anti-inflammatory IL-10 (p<0.05) also showed remarkably in the MSC treatment group. The

10

chinaXiv:202002.00080v1

serum levels of chemokines like IP-10 and growth factor VEGF were both increased, though not significantly (Figure 4).

Figure 4. The ratio of serum cytokines IL-10 (A), growth factor VEGF (B), the chemokine IP-10 (C) and TNF-α (D) before and after MSCs treatment were detected in severe patients compared with the control group without MSCs by panel assay analysis, respectively. Ctrl: placebo control group. P-values were determined using the student’s t-test. *P < 0.05.

10 x RNA-seq analysis for transplanted MSCs

To further elucidate the mechanisms underlying MSC-mediated protection for COVID-19 infected patients, we performed the 10 x RNA-seq survey for transplanted MSCs. The 10 x RNA-seq survey captured 12,500 MSCs which were then sequenced with 881,215,280 raw reads totally (Supplementary Material 4). The results revealed that MSCs are ACE2 or TMPRSS2 negative, indicating that MSCs are free from COVID-19 infection. Moreover, anti- inflammatory and trophic factors like TGF-β, HGF, LIF, GAL, NOA1, FGF, VEGF, EGF, BDNF, and NGF were highly expressed in MSCs, further demonstrating the immunomodulatory function of MSCs. Moreover, SPA and SPC were highly expressed in MSCs, indicating that MSCs might differentiate to AT2 cells (Figure 5). KEGG pathway analysis showed that MSCs were closely involved in the antiviral pathways (Supplementary Material 4).

page11image64038032

11

chinaXiv:202002.00080v1

page12image64818640

Figure 5. The 10 x RNA-seq survey of MSCs genes expression: Both ACE2 (A) and TMPRSS2 (B) were rarely expressed. TGF-β (C), HGF (D), LIF (E), GAL (F), NOA1 (G), FGF (H), VEGF (I), EGF (J), BDNF (K), and NGF (L) were highly expressed, indicating the immunomodulatory function of MSCs. SPA (M) and SPC (N) were highly expressed, indicating MSCs owned the ability to differentiate into the alveolar epithelial cells II. One point represented one cell, and red and gray color showed high expression and low expression,

12

chinaXiv:202002.00080v1

respectively.

Discussion

Both the novel coronavirus and SARS-2003 could enter the host cell by binding the S protein on the viral surface to the ACE2 on the cell surface[3,5]. In addition to the lung, ACE2 is widely expressed in human tissues, including the heart, liver, kidney, and digestive organs[10]. In fact, almost all endothelial cells and smooth muscle cells in organs express ACE2, therefore once the virus enters the blood circulation, it spreads widely. All tissues and organs expressing ACE2 could be the battlefield of novel coronavirus and immune cells. This explains why not only all infected ICU patients are suffering from acute respiratory distress syndrome, but also complications such as acute myocardial injury, arrhythmia, acute kidney injury, shock, and death of multiple organ dysfunction syndrome[11](Figure 6). Moreover, the HCoV-19 is more likely to affect older males with comorbidities and can result in severe and even fatal respiratory diseases such as acute respiratory distress syndrome[21], like the critically severe case here. However, the cure of COVID-2019 is essentially dependent on the patient’s own immune system. When the overactivated immune system kills the virus, it produces a large amount of inflammatory factors, leading to the severe cytokine storms[20]. It suggests that the main reason of these organs damage may be due to virus-induced cytokine storm. Older subjects may be much easier to be affected due to immunosenescence.

Figure 6. ACE2- MSCs benefit the COVID-19 patients via immunoregulatory function

Our 10x scRNA-seq survey shows that MSCs are ACE2- and TMPRSS2- (to the best of our knowledge, it is the first time to be reported) and secrete anti-inflammatory factors to prevent the cytokine storm. They have the natural immunity to the HCoV-19. According to the mass

page13image64066640

13

chinaXiv:202002.00080v1

cytometry streaming results, the virus infection caused a total function failure of the lymphocytes, even of the whole immune system. MSCs played the vital immune modulation roles to reverse the lymphocyte subsets mainly through dendritic cells. Our previous study showed that co-culture with MSCs could decrease the differentiation of cDC from human CD34+ cells, while increasing the differentiation of pDC through PGE2[22]. Furthermore, the induction of IL-10–dependent regulatory dendritic cells and IRF8-controlled regulatory dendritic cells from HSC were also reported in rats[23,24]. MSCs could also induce mature dendritic cells into a novel Jagged-2-dependent regulatory dendritic cell population[25]. All these interactions with different dendritic cells led to a shift of the immune system from Th1 toward Th2 responses.

Several reports also focused on lymphopenia and high levels of C-reactive protein in COVID- 19 patients[20,21]. C-reactive protein is a biomarker with high-sensitivity for inflammation and host response to the production of cytokines, particularly TNFα, IL-6, MCP1 and IL-8 secreted by T cells[26]. However, most mechanistic studies suggest that C-reactive protein itself is unlikely to be a target for intervention. C-reactive protein is also a biomarker of myocardial damage[27].

MSC therapy can inhibit the overactivation of the immune system and promote endogenous repair by improving the microenvironment. After entering the human body through intravenous infusion, part of the MSCs accumulate in the lung, which could improve the pulmonary microenvironment, protect alveolar epithelial cells, prevent pulmonary fibrosis and improve lung function.

As reported by Cao’s team[11], the levels of serum IL-2, IL-7, G-SCF, IP10, MCP-1, MIP-1A and TNF-α in ICU patients were higher than those of normal patients. The cytokine release syndrome caused by abnormally activated immune cells deteriorated the patient’s states which may cause disabled function of endothelial cells, the capillary leakage, the mucus block in lung and finally the respiratory failure. And they could cause even an inflammatory cytokine storm lead to multiple organ failure. The administration of intravenous injection of MSCs significantly improved the inflammation situation in severe COVID-19 patients. Due to its unique immunosuppression capacity, the serum levels of pro-inflammatory cytokines and chemokines were reduced dramatically which attracted less mononuclear/macrophages to fragile lung, while induced more regulatory dendric cells to the inflammatory tissue niche. Moreover, the increased IL-10 and VEGF promoted the lung’s repair. Ultimately, the patients with severe COVID-19 pneumonia survived the worst condition and recovery.

Therefore, the fact that transplantation of MSCs improved the outcome of COVID-2019 patients may be through regulating inflammatory response and promoting tissue repair and regeneration.

Acknowledgement

This work was supported by the National Key Research and Development Program of China

14

chinaXiv:202002.00080v1

(2016YFA0101000, 2018YFE0114200), CAMS Innovation Fund for Medical Sciences (2017- I2M-3-007) and the 111 Project (B18007), National Natural Science Foundation of China (81971324, 81672313, 81700782, 81972523, 81771349).

Conflicts of interest

We have no conflicts of interest.

References

  1. [1]  Munster VJ, Koopmans M, van Doremalen N, van Riel D, de Wit E (2020). A Novel Coronavirus Emerging in China — Key Questions for Impact Assessment. New England Journal of Medicine.
  2. [2]  Xu X, Chen P, Wang J, Feng J, Zhou H, Li X, et al. Evolution of the novel coronavirus from the ongoing Wuhan outbreak and modeling of its spike protein for risk of human transmission. SCIENCE CHINA Life Sciences.
  3. [3]  Lu R, Zhao X, Li J, Niu P, Yang B, Wu H, et al. (2020). Genomic characterisation and epidemiology of 2019 novel coronavirus: implications for virus origins and receptor binding. Lancet (London, England).
  4. [4]  Zhou P, Yang X-L, Wang X-G, Hu B, Zhang L, Zhang W, et al. (2020). A pneumonia outbreak associated with a new coronavirus of probable bat origin. Nature.
  5. [5]  Kuba K, Imai Y, Rao SA, Gao H, Guo F, Guan B, et al. (2005). A crucial role of angiotensin converting enzyme 2 (ACE2) in SARS coronavirus-induced lung injury. Nature Medicine, 11:875-879.
  6. [6]  Ge X-Y, Li J-L, Yang X-L, Chmura AA, Zhu G, Epstein JH, et al. (2013). Isolation and characterization of a bat SARS-like coronavirus that uses the ACE2 receptor. Nature, 503:535- +.
  7. [7]  Hoffmann M, Kleine-Weber H, Krüger N, Müller M, Drosten C, Pöhlmann S (2020). The novel coronavirus 2019 (2019-nCoV) uses the SARS-coronavirus receptor ACE2 and the cellular protease TMPRSS2 for entry into target cells. bioRxiv:2020.2001.2031.929042.
  8. [8]  Glowacka I, Bertram S, Mueller MA, Allen P, Soilleux E, Pfefferle S, et al. (2011). Evidence that TMPRSS2 Activates the Severe Acute Respiratory Syndrome Coronavirus Spike Protein for Membrane Fusion and Reduces Viral Control by the Humoral Immune Response. Journal of Virology, 85:4122-4134.
  9. [9]  Iwata-Yoshikawa N, Okamura T, Shimizu Y, Hasegawa H, Takeda M, Nagata N (2019). TMPRSS2 Contributes to Virus Spread and Immunopathology in the Airways of Murine Models after Coronavirus Infection. Journal of Virology, 93.
  10. [10]  Hamming I, Timens W, Bulthuis MLC, Lely AT, Navis GJ, van Goor H (2004). Tissue distribution of ACE2 protein, the functional receptor for SARS coronavirus. A first step in understanding SARS pathogenesis. Journal of Pathology, 203:631-637.
  11. [11]  Huang C, Wang Y, Li X, Ren L, Zhao J, Hu Y, et al. Clinical features of patients infected with 2019 novel coronavirus in Wuhan, China. The Lancet.
  12. [12]  Connick P, Kolappan M, Crawley C, Webber DJ, Patani R, Michell AW, et al. (2012). Autologous mesenchymal stem cells for the treatment of secondary progressive multiple sclerosis: an open-label phase 2a proof-of-concept study. Lancet Neurology, 11:150-156.

15

chinaXiv:202002.00080v1

  1. [13]  Wilson JG, Liu KD, Zhuo NJ, Caballero L, McMillan M, Fang XH, et al. (2015). Mesenchymal stem (stromal) cells for treatment of ARDS: a phase 1 clinical trial. Lancet Respiratory Medicine, 3:24-32.
  2. [14]  Hashmi S, Ahmed M, Murad MH, Litzow MR, Adams RH, Ball LM, et al. (2016). Survival after mesenchymal stromal cell therapy in steroid-refractory acute graft-versus-host disease: systematic review and meta-analysis. Lancet Haematology, 3:E45-E52.
  3. [15]  Kamen DL, Nietert PJ, Wang H, Duke T, Cloud C, Robinson A, et al. (2018). CT-04 Safety and efficacy of allogeneic umbilical cord-derived mesenchymal stem cells (MSCs) in patients with systemic lupus erythematosus: results of an open-label phase I study. Lupus Science &amp; Medicine, 5:A46-A47.
  4. [16]  Galipeau J, Sensebe L (2018). Mesenchymal Stromal Cells: Clinical Challenges and Therapeutic Opportunities. Cell Stem Cell, 22:824-833.
  5. [17]  Bernardo ME, Fibbe WE (2013). Mesenchymal Stromal Cells: Sensors and Switchers of Inflammation. Cell Stem Cell, 13:392-402.
  6. [18]  Waterman RS, Tomchuck SL, Henkle SL, Betancourt AM (2010). A new mesenchymal stem cell (MSC) paradigm: polarization into a pro-inflammatory MSC1 or an Immunosuppressive MSC2 phenotype. PLoS One, 5:e10088.
  7. [19]  Li W, Ren G, Huang Y, Su J, Han Y, Li J, et al. (2012). Mesenchymal stem cells: a double-edged sword in regulating immune responses. Cell Death Differ, 19:1505-1513.
  8. [20]  Wang D, Hu B, Hu C, Zhu F, Liu X, Zhang J, et al. (2020). Clinical Characteristics of 138 Hospitalized Patients With 2019 Novel Coronavirus–Infected Pneumonia in Wuhan, China. JAMA.
  9. [21]  Chen N, Zhou M, Dong X, Qu J, Gong F, Han Y, et al. (2020). Epidemiological and clinical characteristics of 99 cases of 2019 novel coronavirus pneumonia in Wuhan, China: a descriptive study. Lancet (London, England).
  10. [22]  Chen L, Zhang W, Yue H, Han Q, Chen B, Shi M, et al. (2007). Effects of human mesenchymal stem cells on the differentiation of dendritic cells from CD34(+) cells. Stem Cells and Development, 16:719-731.
  11. [23]  Liu X, Qu X, Chen Y, Liao L, Cheng K, Shao C, et al. (2012). Mesenchymal Stem/Stromal Cells Induce the Generation of Novel IL-10-Dependent Regulatory Dendritic Cells by SOCS3 Activation. Journal of Immunology, 189:1182-1192.
  12. [24]  Liu X, Ren S, Ge C, Cheng K, Zenke M, Keating A, et al. (2015). Sca-1(+)Lin(-)CD117(-) Mesenchymal Stem/Stromal Cells Induce the Generation of Novel IRF8-Controlled Regulatory Dendritic Cells through Notch-RBP-J Signaling. Journal of Immunology, 194:4298-4308.
  13. [25]  Zhang B, Liu R, Shi D, Liu X, Chen Y, Dou X, et al. (2009). Mesenchymal stem cells induce mature dendritic cells into a novel Jagged-2-dependent regulatory dendritic cell population. Blood, 113:46-57.
  14. [26]  Sproston NR, Ashworth JJ (2018). Role of C-Reactive Protein at Sites of Inflammation and Infection. Frontiers in Immunology, 9.
  15. [27]  Bisoendial RJ, Boekholdt SM, Vergeer M, Stroes ESG, Kastelein JJP (2010). C-reactive protein is a mediator of cardiovascular disease. European Heart Journal, 31:2087-U1505.

16

chinaXiv:202002.00080v1

Table 1: Clinical classification of the COVID-19 released by the National Health and Health Commission of China

MildCommonSevere Critically severe 
Mild clinical manifestation, None Imaging PerformanceFever, respiratory symptoms, pneumonia performance on X-ray or CTMeet any of the followings:
1. Respiratory distress, RR ≥ 30/min;
2. Oxygen saturation ≤ 93% at rest state;
3. Arterial partial pressure of oxygen (PaO2) / Fraction of inspiration O2 (FiO2) ≤ 300mnHg, 1mmHg=0.133kPa
Meet any of the followings:
1. Respiratory failure needs mechanical ventilation;
2. Shock;
3. Combined with other organ failure, patients need ICU monitoring and treatment 

chinaXiv:202002.00080v1

Table 2: The general information of the enrolled patients.

Patient 1Patient 2Patient 3Patient 4Patient 5Patient 6Patient 7Ctrl Patient 1 Ctrl Patient 2Ctrl Patient 3 
GenderMFFFMMMFFF
Age (years)65636551574553 75 74 46 
COVID-19 typeCritically severeSevereSevereCommonCommonSevereSevereSevereSevereSevere
Fever (°C, baseline)38.637.738.238.538.439.039.0 36.038.9 37.7
Shortness of breath++++++++++++++++++++++
Oxygen saturation at rest state89%93%92%95%94%92%90%91%92%93%
Cough, weak, poor appetite++++++++++++ + ++ + 
Diarrhea+
Date of diagnosedJan 23Jan 27Jan 25Feb 3Feb 2Jan 27Feb 3 Feb 3Feb 6 Feb 5
Date of intervention (MSCs or Placebo)Jan 31Feb 2Feb 4Feb 4Feb 4Feb 6Feb 6Feb 8Feb 6Feb 6
Date of recoveryFeb 3Feb 4Feb 6 DischargedFeb 6 DischargedFeb 5 DischargedFeb 7Feb 7DeadARDSStable

chinaXiv:202002.00080v1

Table 3: Symptoms, signs and maximum body temperatures of the critically severe patient from Jan 21 to Feb 13, 2020. ICU: Intensive Care Unit; NA: Not Available

HomeHospitalHospitalICUICUICUICUICUOut of ICUHospitalHospital
DateJan 21~22Jan 23Jan 24~29Jan 30Jan 31Feb 1Feb 2~3Feb 4Feb 5~8Feb 9~12Feb 13
Fever (°C)37.537.837.0~38.538.638.836.836.6~36.936.836.6~36.836.5~36.936.6
Shortness of breath+++++++++++
Cough+++++++++
Sputum+++++++++
Oxygen saturation (without / with O2 uptake)NA / NANA / NA97% / NA91% / 95%89% / 94%NA / 98%NA / 97%NA / 96%NA / 97%96% / NA97% / NA
Respiratory rateNA2323273322222120~2220~2221
Treatment
(Basics-1: Antipyretic, antiviral and supportive therapy. Basics-2: antiviraland supportive therapy)
NANABasics-1Basics-1; Mask O2 5L/minBasics-1; Mask O2 10L/min; Cell transplantBasics-1; Mask O25L/minBasics-2; Mask O25L/minBasics-2; Mask O25L/minBasics-2; Mask O25L/minBasics-2Basics-2
RT-PCR of the virusNAPositiveNANANANANANAPositive (Feb 6)NANegative

chinaXiv:202002.00080v1

Table 4: The laboratory results of the critically severe patient. Red: the value was above the normal. Blue: the value was below the normal. NA: Not Available

Reference range Jan 24 Jan 30Jan 31 Feb 1 Feb 2Feb 4 Feb 6 Feb 10Feb 13
C-reactive protein (ng/mL)< 3.002.20105.50NA191.0083.4013.6022.7018.3010.10
Absolute lymphocyte count (× 109 per liter)1.10-3.20 0.940.600.35 0.230.350.58 0.870.730.93
White-cell count (× 109 per liter)3.50-9.504.916.357.907.0812.1612.5711.2610.658.90
Absolute neutrophil count (× 109 per liter)1.80-6.30 3.435.437.28 6.6311.3311.10 9.439.187.08
Absolute monocyte count (× 109 per liter)0.10-0.60 0.380.250.17 0.130.350.61 0.520.480.56
Red-cell count (× 1012 per liter)4.30-5.804.69 4.684.664.78 4.734.755.16 4.694.53
Hemoglobin (g/L)130.00-175.00145.00147.00145.00146.00142.00145.00155.00145.00137.00
Platelet count (× 109 per liter)125.00-350.00153.00148.00169.00230.00271.00268.00279.00332.00279.00
Absolute eosinophil count (× 109 per liter)0.02-0.52 0.020.020.02 0.020.020.05 0.150.140.14
Absolute basophilic count (× 109 per liter)0.00-0.06 0.020.010.02 0.020.020.06 0.100.030.04
Total bilirubin (μmol/L)5.00-21.007.0023.0021.7019.8014.2015.8016.5012.508.70
Albumin (g/L)40.00-55.00 41.7032.3029.70 29.9031.6033.00 32.2030.1029.10
Aspartate amino transferase (U/L)15.00-40.0014.0033.0048.0057.0039.0034.0023.0025.0019.00
Fibrinogen (g/L)2.00-4.00 2.444.24NA NA4.73NA 3.123.843.73
Procalcitonin (ng/mL)< 0.10 0.110.12NA NANA0.10 0.180.15< 0.10
Creatine kinase isoenzymes (ng/mL)< 3.600.900.12NA5.674.24NA0.880.900.61
Creatine kinase (U/L)50.00.310.00 168.00231.00NA 513.00316.00NA 47.0083.0040.00
Glomerular filtration rate (ml/min)> 90.00 81.30 68.0089.60 99.00 104.0092.50 108.10 97.1094.10
Potassium (mmol/L)3.50.5.303.612.743.003.423.474.184.364.694.61
Sodium (mmol/L)137.00.147.00 138.50132.60129.50 132.80136.90135.80 133.80134.10137.70
Myoglobin (ng/mL)16.00.96.0053.0080.00NA138.0077.00NA62.0060.0043.00
Troponin (ng/mL) < 0.056   0.100.07NA   0.05 0.05NA   0.020.040.04

chinaXiv:202002.00080v1

Supplementary Materials:
Supplementary 1: The method of Mass Cytometry of peripheral blood mononuclear cells (PBMC)
Sample preparation for mass cytometry
PBMC samples were collected from COVID-19 infected patients treated with MSCs transplantation at baseline and on Day 6, and PBMC from a healthy donor were set as the control group. All samples were cultured with 2 μM cisplatin (195-Pt, Fluidigm) for 2 minutes before quenching with CSB (Fluidigm) to identify the viability using mass cytometry analysis. A Fix-I buffer (Fluidigm) was then used to fix cells for 15 min at room temperature, followed by washing three times with phosphate buffer solution (PBS).
Mass cytometry antibody staining and CD45 barcoding
Three samples from the healthy donor, the patient at baseline and Day 6 were stained with CD45 antibodies that were labeled with different metal tags (89, 141 and 172) to minimize internal cross reaction between samples. MaxPar × 8 Polymer Kits (Fluidigm) were used to conjugate with purified antibodies (listed in Supplemental Table 1). All metal-conjugated antibodies were titrated for optimal concentrations before use. Cells were counted and diluted into 1× 10⁶ cells per milliliter in PBS and underwent permeabilization with 80% methanol for 15 minutes at 0°C. After triple washes in CSB, cells were cultured with antibodies in a total 50 μL CSD for 30 min in RT, triple washed in CSB and incubated with 0.125 μm intercalator in fix and perm buffer (Fluidigm) at 4 °C overnight.
Data acquisition in Helios
After cultured with intercalator, cells were washed three times with ice cold PBS and three times with deionized water. Prior to acquisition, samples were resuspended in deionized water containing 10% EQ 4 Element Beads (Fluidigm) and cell concentrations were adjusted to 1×10⁶ cell/ml. Data acquisition was performed on a Helios mass cytometer (Fluidigm). The original FCS data were normalized and .fcs files for everyone were collected.
CyTOF Data Analysis
All .fcs files were uploaded into Cytobank, data cleaning and populations of single living cells were exported as .fcs files for further analysis. Files were loaded into R (http://www.rstudio.com), arcsinh transform was performed to signal intensities of all channels. PhenoGraph analysis was performed.

Supplementary 2: The method of the 10 x RNA-seq survey
Materials and reagents
All supplies and reagents were of the highest grade commercially available. The 0.20 μm-filters, dishes and tubes were purchased from Corning (NY, USA). CD105, CD90, CD44 and CD45 antibodies for the flow cytometry were purchased from Miltenyi Biotec (Bergisch gladbach, Germany). DMEM/F12, fetal bovine serum (FBS), GlutaMAXTM-I, TrypLETM Express, and penicillin and streptomycin antibiotics were purchased from Gibco (California, USA). All other reagents were analytical grade and required no further purification.

page21image254880832

17

chinaXiv:202002.00080v1

Supplemental Table 1: Antibodies used in the Mass cytometry analysis.

Antigen Symbol and Mass

CD45 89Y CD45 141Pr CD19 142Nd CD5 143Nd CCR5 144Nd CD4 145Nd CD45RA 146N CD20 147Sm CD14 148Nd CD56 149Sm CD11c 150Nd CD16 151Eu TNFα 152Sm CD62L 153Eu IL-1β 154Sm CD27 155Gd CXCR3 156Gd IFN-r 158Gd CCR7 159Tb CD28 160Gd CD25 161Dy CD8 162Dy TGFβ 16Dy CD45RO 164Dy IL-12 165Ho IL-10 166Er IL-6 167Er CD206 168Er CD24 169Tm CD3 170Er CD68 171Yb CD45 172Yb HLA-DR 173Yb IL-4 174Yb CD127 176Yb CD11b 209Bi

Cell culturing

The mesenchymal stem cells were cultured in DMEM/F12 medium supplemented with 2% FBS, 2%

page22image47197904
page22image47196224
Antibody CloneSource
HI30Fluidigm
HI30Fluidigm
HIB19Fluidigm
UCHT2Fluidigm
NP-6G4Fluidigm
RPA-T4Fluidigm
HI100Biolegend
H1Fluidigm
RMO52Fluidigm
NCAM16.2Fluidigm
Bu15Biolegend
3G8Biolegend
MAb11Fluidigm
DREG-56Fluidigm
PolyclonalAbcam
L128Fluidigm
G025H7Fluidigm
B27Fluidigm
G043H7Fluidigm
CD28.2Fluidigm
BC96biolegend
RPA-T8Fluidigm
TW46H10Fluidigm
UCHL1Fluidigm
PolyclonalAbcam
JES3-9D7Fluidigm
MQ2-13A5Biolegend
15-2Fluidigm
ML5Fluidigm
UCHT1Fluidigm
Y1/82AFluidigm
HI30biolegend
L243Fluidigm
MP4-25D2Biolegend
A019D5Fluidigm
ICRF44Fluidigm
page22image255227200
page22image255227968
page22image255228736
page22image255328000
page22image255197760
page22image255198720

18

chinaXiv:202002.00080v1

GlutaMAXTM-I, 1% antibiotics and 2 mM GlutaMAXTM-I at 37°C with 5% CO2. After three passages, MSCs were immune-phenotyped by flow cytometry for the following surface markers: CD105, CD90, CD73, CD29, HLA-DR, CD44, CD14 and CD45 (all antibodies from BD Pharmingen, San Jose, USA). And MSCs were tested for adipogenic, chondrogenic and osteogenic differentiation to identify their characters.

Cell preparation and Library construction

Cell count and viability were examined by microscope after 0.4% trypan blue coloring. When the viability was no lower than 80%, the library construction was performed. Library was constructed using the Chromium controller (10 x Genomics, Pleasanton, CA). Briefly, single cells, reagents and Gel Beads containing barcoded oligonucleotides were encapsulated into nanoliter-sized GEMs (Gel Bead in Emulsion) using the GemCode technology. Lysis and barcoded reverse transcription of polyadenylated mRNA from single cells were performed inside every GEM. Post RT-GEMs were cleaned up and cDNA were amplified. cDNA was fragmented and fragment ends were repaired, as well as A-tailing was added to the 3’ end. The adaptors were ligated to fragments which were double sided SPRI selected. Another double sided SPRI selecting was carried out after sample index PCR. Quality control-pass libraries were sequenced. The final library was quantitated in two ways: determining the average molecule length using the Agilent 2100 bioanalyzer instrument; and quantifying the library by real-time quantitative PCR.

Analysis of single-cell transcriptomics data

The reads were demultiplexed by using the Cell Ranger Single Cell Software Suite (v3.1.0, 10 x Genomics) and R package Seurat (v3.1.0). The number of genes, unique molecule identifier (UMI) counts and percentage of mitochondrial genes were examined to identify outliers. Principal component analysis was used for dimensionality reduction. U-MAP was then used for two- dimensional visualization of the results. DEGs were identified with the FindConservedMarkers function in Seurat by parameters of logfc.threshold >0.25, minPct>0.25 and Padj≤0.05. KEGG pathways with FDR ≤0.05 were considered to be significantly enriched.

Supplementary 3: The detailed diagnosis and treatment procedures for the critically severe patient
On the evening of January 22, 2020, a 65-year-old man presented to the emergency department of Beijing YouAn Hospital, Beijing, with a 2-day history of cough, sputum and subjective fever. The patient wore a mask in the hospital. He disclosed to the physician that he had traveled in Wuhan, China, from December 31, 2019 to January 20, 2020 and returned to Beijing on January 20. Apart from a 10-year history of hypertension with the highest blood pressure of 180/90 mmHg ever, the patient had no other specific medical history. The physical examination showed a body temperature of 37.8, blood pressure of 138/85 mmHg, pulse of 85 beats per minute, respiratory rate of 19 breaths per minute. Lung auscultation revealed rhonchi. A blood routine examination was arranged urgently, and the result revealed that the white-cell count and absolute lymphocyte count were 4.9 × 10⁹/L (reference range (3.5~9.5) × 109/L) and 0.94 × 10⁹/L (reference range (1.1~3.2) × 109/L),

19

chinaXiv:202002.00080v1

respectively (Table 1). According to the COVID-19 guidance released by the National Health Commission of China, the physician gave him a diagnosis of a suspected COVID-19 case and asked him to undergo medical isolation observation in the hospital. Meantime, the doctor collected his oropharyngeal swab specimen.

On January 23, 2020, the RT-PCR assay confirmed that the patient’s specimen tested positive for HCoV-19. Then the patient was admitted to an airborne-isolation unit in Beijing YouAn Hospital for clinical observation. He had no dyspnea. His consciousness was clear, and the diet and sleep were normal since he became sick. A chest computed tomography (CT) was reported as showing no evidence of infiltrates or abnormalities. The admitting diagnoses were new coronary pneumonia (common type) and hypertension III. The patient received no special care except the irbesartan, which was taken all through the treatment period.

On January 24 to January 29, the patient’s vital physical signs remained largely stable, apart from the development of intermittent fevers and shortness of breath. During this time, the patient received antipyretic therapy including 15 ml of ibuprofen suspension every 6 hours and 650 mg of acetaminophen every 6 hours. From January 26, the patient also received antiviral therapy including lopinavir and ritonavir twice a day, with the amount of 400 mg and 100 mg each time, respectively. On January 30, the patient felt severe shortness of breath and appeared fatigued. The oxygen saturation values measured by pulse oximetry decreased to as low as 91% while he was breathing ambient air. Auscultation rhonchi became worse in the middle of the double sides of the lung. An urgent chest CT clearly showed evidence of pneumonia, ground-glass opacity, in the middle lobes of the right and left lung. The other positive results of laboratory tests included the C-reactive protein rise to 105.5 g/L (reference range < 3 g/L), but the absolute lymphocyte count decreased to 0.60 × 10⁹/L. The potassium concentration went down to 2.74 mmol/L (reference range 3.5-5.5 mmol/L). The doctors decided to change the diagnosis to COVID-19 (critically severe type), and the patient was admitted to ICU unit. More treatments were conducted consisting of mask oxygen supplementation (5 liters per minute), electrocardiograph monitoring, potassium chloride sustained release tablets (oral, 500 mg per time, 3 times per day) and more glucose and amino acid injection. Finally, the discomfort was released, and the oxygen saturation increased to 95%.

On January 31, the shortness of breath even got worse under the oxygen supplementation. The doctor speeded up the oxygen airflow to 10 liters per minute. After the patient signed an agreement to perform the MSCs transplantation, 100 ml of normal saline including 6 × 10⁷ MSCs was intravenously injected into the patient, and no adverse events were observed in association with the infusion.

On February 1 and 2, the patient did not feel better. The third chest CT revealed that the pneumonia got worse. On February 1, the levels of C-reactive protein were 191.0 g/L, and the absolute lymphocyte count decreased badly to 0.23 × 10⁹/L. The laboratory results showed that his liver and myocardium were very likely to be affected. The electrocardiograph monitoring showed the blood pressure, heart rate, respiratory rate and oxygen saturation were 138/80 mmHg, 95 bpm, 33 bpm and 93% under the mask oxygen supplementation of 10 liters per minute. The doctors informed the

20

chinaXiv:202002.00080v1

patient’s families of a critical condition.
However, the patient felt better on February 3, for instance, the shortness of breath was significantly recovering. On February 4, the C-reactive protein decreased to 13.6 g/L, and the absolute lymphocyte count rose to 0.58 × 10⁹/L, which indicated that the patient was recovering rapidly. The indexes of liver and myocardium function recovered. Both fever and shortness of breath disappeared on February 5. He was rolled out of ICU. On February 9, the fourth chest CT confirmed that the pneumonia was disappearing. On February 13, the C-reactive protein concentration was 10.1 g/L, and the absolute lymphocyte count was 0.93 × 10⁹/L. Up to now, the patient felt much better.

Supplementary 4: More results of the 10 x RNA-seq surevey
Flow cytometry analysis
The PI staining results showed that 91.60% of the total cell population was alive, and the cells were: CD105+, CD90+, CD73+, CD44+, CD29+, CD14- and CD45- (Supplemental Figure 1).

Supplemental Figure 1. Flow cytometry evaluation of transplanted MSCs (A) Single cells (87%) were gated firstly. (B) Live cells (91% of the single cells) were enrolled. (C-F) 99% of selected cells were CD105+, CD90+, CD73+, CD44+, CD29+, CD14- and CD45-.

The overview of the survey

A deep transcriptional states map of MSCs and gene expression at single-cell level was generated after the performance of 10× Genomics high throughput of RNA sequencing. The 12,500 cells were acquired in the survey, leading to 881,215,280 raw reads totally. The median number of genes and UMIs detected per cell were 4,099 and 23,971, respectively (Supplemental Figure 2). The sequencing saturation rate was 72.9%, which met the scRNA-seq requirements.

page25image64824880

21

chinaXiv:202002.00080v1

page26image64801424

Supplemental Figure 2. In the 10 x RNA-seq survey, the median number of genes and UMIs detected per cell were 4,099 (A) and 23,971 (B) as showed in the violin distribution.

MSCs marker genes expression

The scRNA-seq showed that the MSCs highly expressed ENG (CD105), THY1 (CD90), and NT5E (CD73). However, the expression of PTPRC (CD45), CD34, CD14, CD19, and HLA-DR was nearly undetected in the cells (CD45 was the only one shown in Supplemental Figure 3). The results were in accordance with the flow cytometry analysis. In Supplemental Figure 3, one point meant one cell, and red and gray color represented high expression and low expression, respectively.

Supplemental Figure 3. MSCs marker genes expression by 10 x scRNA-seq analysis. (A) CD105+, (B) CD90+, (C) CD73+, and (D) CD45-

ACE2 gene expression and DEGs between ACE2MSC and ACE2– MSC

Only one of the 12,500 cells was ACE2+ as shown in Supplemental Figure 4A. Furthermore, the top 60 DEGs between the ACE2+ MSC and the other nearby ACE2- MSC were shown in Supplemental Figure 4B. It is revealed that the ACE2+ MSC tended to generate pro-inflammatory function by

page26image64800800

22

chinaXiv:202002.00080v1

secreting IL-8, IL-6 and so on, while ACE2- MSC tended to generate anti-inflammatory effect by secreting BDNF and other factors.

Supplemental Figure 4. (A) ACE2 gene expression in MSCs. (B) top 60 DEGs between one ACE2+ MSC and one ACE2- MSC

page27image64906176

23

chinaXiv:202002.00080v1

TMPRSS2 gene expression and DEGs between TMPRSS2 MSC and TMPRSS2 – MSC

Only seven of the 12,500 cells were TMPRSS2+ as shown in Supplemental Figure 5A. Furthermore, the top 60 DEGs between the TMPRSS2+ MSC and the other seven nearby TMPRSS2- MSC were shown in Supplemental Figure 5B.

Supplemental Figure 5. (A) TMPRSS2 gene expression in MSCs. (B) top 60 DEGs between seven TMPRSS2+ MSCs and seven TMPRSS2- MSCs

page28image64832112

24

chinaXiv:202002.00080v1

Kyoto Encyclopedia of Genes and Genomes (KEGG) analysis

KEGG pathway analysis demonstrated diseases mainly related to viral infectious diseases, cancers and endocrine and metabolic disorders (1727 genes, 1605 genes and 1384 genes, respectively). Organismal systems mainly related to endocrine and immune systems (1578 genes and 748 genes, respectively) (Supplemental Figure 6). Four enriched KEGG pathways were also involved in viral infection (Supplemental Figure 7).

Supplemental Figure 6. Kyoto Encyclopedia of Genes and Genomes (KEGG) analysis revealed that many gene expressions of MSCs were related with endocrine and immune systems.

page29image64926096

25

chinaXiv:202002.00080v1

page30image64189024

Supplemental Figure 7. Four enriched KEGG pathways were also involved in viral infection.

26

Posted in Most Recent | Leave a comment

Furin, a potential therapeutic target for COVID-19

Furin, a potential therapeutic target for COVID-19

Canrong WU,a,1Yueying YANG,b,1Yang LIU,bPeng ZHANG,bYaliWANG,bQiqi WANG, b Yang XU,bMingxue LI,bMengzhu ZHENG,a,* Lixia CHEN,b,* &Hua LIa,b,*

aHubei Key Laboratory of Natural Medicinal Chemistry and Resource Evaluation, School of Pharmacy, Tongji Medical College, Huazhong University of Science and Technology, Wuhan 430030, China
bWuya College of Innovation, Key Laboratory of Structure-Based Drug Design & Discovery, Ministry of Education, Shenyang Pharmaceutical University, Shenyang 110016, China

page1image54268032

1 These authors contributed equally to this work. *Corresponding author: Hua Li (E-mail: li_hua@hust.edu.cn).

Lixia Chen (syzyclx@163.com).
Mengzhu Zheng (mengzhu_zheng@hust.edu.cn).

chinaXiv:202002.00062v1

Abstract

A novel coronavirus (SARS-CoV-2) infectious disease has broken out in Wuhan, Hubei Province since December 2019, and spread rapidly from Wuhan to other areas, which has been listed as an international concerning public health emergency. We compared the Spike proteins from four sources, SARS-CoV-2, SARS-CoV, MERS-CoV and Bat-CoVRaTG13, and found that the SARS-CoV-2 virus sequence had redundant PRRA sequences. Through a series of analyses, we propose the reason why SARS-CoV-2is more infectious than other coronaviruses. And through structure based virtual ligand screening, we foundpotentialfurin inhibitors, which might be used in the treatment of new coronary pneumonia.

Keywords:SARS-CoV-2;Spike proteins;Furin;Inhibitors;Virtual screening

chinaXiv:202002.00062v1

1. Introduction

In December 2019, a series of acute respiratory diseases occurred in Wuhan, Hubei Province, China and then spread rapidly from Wuhan to other areas. As of February 17, 2020, a total of 71,444 patients have been diagnosed and 1,775 have died worldwide. This is caused by a novel coronavirus, which was named as “2019-nCoV” by the World Health Organization, and diseases caused by 2019-nCoV was COVID-19. 2019-nCoV, as a close relative of SARS-CoV, was classified as severe acute respiratory syndrome coronavirus 2 (SARS-CoV-2) by the International Committee on Taxonomy of Viruses (ICTV) on February 11, 2020.

Coronaviruses (CoVs) are mainly composed of four structural proteins, including Spike (S), membrane (M), envelope (E) and nucleocapsid (N) [1]. Spike, a trimeric glycoprotein of CoVs, determines diversity of CoVs and host tropism, and mediates CoVs binding to host cells surface-specific receptors and virus-cell membrane fusion [2]. Current research found that SARS-CoV-2 belongs to the beta coronavirus genus, and speculated that it may interact with angiotensin-converting enzyme 2 (ACE2) on the surface of human cells through Spike protein, thereby infecting human respiratory epithelium cell [3]. Letko M and Munster Vthen identified the receptor for SARS-CoV-2 entry into human cells to be ACE2 [4].

Coronavirus Spike protein plays a key role in the early stages of viral infection, with the S1 domain responsible for receptor binding and the S2 domain mediating membrane fusion [5]. The process of SARS-CoV infecting the host involves two indispensable cleaving processes which affect the infectious capacity of SARS-CoV. First, Spike was cleaved into receptor-bound N-terminal S1 subunit and membrane-fusion C-terminal S2 subunit by host proteases at S1/S2 cleavage site (such as type II transmembrane serine protease (TMPRSS2), cathepsins B and L) [6,7]. Second, after CoVs are endocytosed by the host, the lysosomal protease mediates cleavage of S2 subunit (S2’ cleavage site) and releases the hydrophobic fusion peptide to fuse with the host cell membrane [8].

Furin, a kind of proprotein convertases (PCs), is located in the trans-Golgi network (TGN) and activated by acid pH [9]. Furin can cleave precursor proteins with specific motifs to produce mature proteins with biological activity. The first (P1) and fourth (P4) amino acids at the N-terminus of the substrate cleavage site must be arginine “Arg-X-X-Arg ↓” (R-X-X-R,X: any amino acid, ↓:cleavage site). If the P2 position is basic lysine or arginine, the cleavage efficiency

chinaXiv:202002.00062v1

can be improved by about 10 times [10]. Kibler KV et al. demonstrated that the Spike protein S1/S2 and S2′ cleavage sites of the infectious bronchitis virus (IBVs) Beaudette strain can be recognized by fruin, which is a distinctive feature of IBV-Beaudette with other IBVs and has stronger infection ability [11,12]. Based on the characteristics of furin’s recognition substrate sequence, some short peptide inhibitors have been developed, such as Decanoyl-Arg-Val-Lys-Arg-chloromethylketone (Dec-RVKR-CMK) and modified α1-antitrypsin Portland (α1-PDX). However, the non-specific and irreversible inhibitory effects on all members of the PC family limit their application [10, 13]. No small molecule inhibitor of furin with good effect and high specificity has been found so far.

The epidemiological observations showed the infectious capacity of SARS-CoV-2 is stronger than SARS-CoV, so there are likely to be other mechanisms to make the infection of SARS-CoV-2 easier. We suppose the main possibilities as follows, first, SARS-CoV-2 RBD combining with ACE2 may have other conformations; second, the SARS-CoV-2 Spike protein can also bind to other receptors besides ACE2; third, Spike is more easily cleaved by host enzymes and easily fuses with host cell membrane. We compared the Spike proteins from four sources, SARS-CoV-2, SARS-CoV, MERS-CoV and Bat-CoVRaTG13, and found that the SARS-CoV-2 virus sequence had redundant PRRA sequences. Through a series of analyses, this study propose that one of the important reasons for the high infectivity of SARS-CoV-2 is a redundant furin cut site in its Spike protein.And through structure based virtual ligand screening, we proposed possible furin inhibitors, which might be potentially used in the treatment of COVID-19.

2. Methodology
2.1 Homology Spike protein blast and sequence alignment.

The Spike protein of(GB:QHR63250.1) was downloaded from NCBI nucleotide database. The protein sequence were aligned with whole database using BLASTp to search for homology viral Spike protein (Alogorithm parameters, Max target sequences: 1000, Expect threshold: 10). Multiple-sequence alignment was conducted in BLASTp online and analysis with DNAMAN and Jalview. The evolutionary history was inferred using the Neighbor-Joining method in MEGA 7 software package. The percentage of replicate trees in which the associated taxa clustered together in the bootstrap test wasdetermined by 500 replicates. The Spike protein sequence analyses were

chinaXiv:202002.00062v1

conducted in snapgene view.

2.2 Furin cleavage site prediction

The prediction of furin cleavage sites were carried out in ProP 1.0 Server (http://www.cbs.dtu.dk/services/ProP/).
2.3 Compounds database

Approved drug database was from the subset of ZINC database, ZDD (ZINC drug database) containing 2924 compounds [14]. Natural products database was constructed by ourselves, containing 1066 chemicals separated from traditional Chinese herbals in own lab and natural-occurring potential antiviral components and derivatives. Antiviral compounds library contains 78 known antiviral drugs and reported antiviral compounds through literature search.

2.4 Homology modeling and molecular docking

Corresponding homology models predicted by Fold and Function Assignment System server for each target protein were downloaded from Protein Data Bank (www.rcsb.org). Alignment of two protein sequences and subsequent homology modeling were performed by bioinformatics module of ICM 3.7.3 modeling software on an Intel i7 4960 processor (MolSoft LLC, San Diego, CA). For the structure-based virtual screening, ligands were continuously resiliently made to dock with the targetthat was represented in potential energy maps by ICM 3.7.3 software, to identify possible drug candidates. 3D compounds of each database were scored according to the internal coordinate mechanics (Internal Coordinate Mechanics, ICM)[15]. Based on Monte Carlo method, stochastic global optimization procedure and pseudo-Brownian positional/torsional steps, the position of intrinsic molecular was optimized. By visually inspecting, compounds outside the active site, as well as those weakly fitting to the active site were eliminated. Compounds with Scores less than -30 or mfScores less than -100 (generally represents strong interactions) have priority to be selected. Protein-protein docking procedure was performed according to the ICM-Pro manual.

3. Results
3.1 Bioinformatics analysis reveals furin cut site in Spike protein of SARS-CoV-2

By sequence alignment of Spike protein sequence of SARS-CoV-2 with its highly homologous sequences, it was found that cleavage site Spike of SARS-CoV-2 had 4 redundant

page5image53550208

chinaXiv:202002.00062v1

amino acids-PRRA, and these were not found in those of high homology coronavirus, which formed a furin-like restriction site as RRAR(Figure S1). Through prediction in ProP 1.0 Server, it was found the sequence was indeed easily digested by furin(Figure S2). In order to explore the evolution of this sequence, we used the BLASTp method to find 1,000 homologous Spike sequences with homology from 100% to 31%, which all from beta CoVs. Multiple sequence alignments were performed on these thousands of Spike sequences. One sequence was selected from each highly homologous class (homology greater than 98.5%) for further sequence alignment, and about 155 sequences were finally selected. A homologous multiple sequence alignment was performed on these 155 sequences, and then a phylogenetic tree was constructed(Figure 1). It is found from the phylogenetic tree that the Spike of SARS-CoV-2 exhibited the closest linkage to those of Bat-SL-CoV and SARS-CoV, and far from those of MERS-CoV, HCoV-HKU1, HCoV-OC43. In general, most of the Spike protein in α-CoV does not have a furin cleavage site, most of that in gama-CoV has a furin cleavage site, and that in beta-CoV with or without furin cleavage site are common[16].

We performed furin digestion site prediction on the sequence of each type of coronavirus Spikethrough online software. It was found that all Spike with a SARS-CoV-2 Spike sequence homology greater than 40% did not have a furin cleavage site (Figure 1, Table 1), including Bat-CoV RaTG13 and SARS-CoV (with sequence identity as 97.4% and 78.6%, respectively). The furin cleavage site “RRAR” in SARS-CoV-2 is unique in its family, rendering by its unique insert of “PRRA”. The furin cleavage site of SARS-CoV-2 is unlikely to have evolved from MERS, HCoV-HKU1, and so on. From the currently available sequences in databases, it is difficult for us to find the source. Perhaps there are still many evolutionary intermediate sequences waiting to be discovered.

By analysis of the SARS -CoV-2 Spike protein sequence, it was found that most features are similar to SARS-CoV. It has an N-terminal signal peptide and is divided into two parts, S1 and S2. Among them, S1 contains N-terminal domain and receptor binding region. And S2 is mainly responsible for membrane fusion. The C-terminal region of S2 is S2′, containing a fusion peptide, Hetad repeat1, Hetad repeat 2, and a transmembrane domain(Figure 2). There are two cleavage sites between S1 and S2 ‘, named CS1 and CS2. However, there are some differences in this two cleavage sites.

chinaXiv:202002.00062v1

Unlike SARS-CoV, SARS-CoV-2 contains polybasic amino acids (RRAR) at the CS1 digestion site, and trypsin digestion efficiency will be significantly improved here[5]. More importantly, as mentioned above, this site can be recognized and cleaved by the furin enzyme. The cleavage of Spike protein promotes structural rearrangements of RBD for the adaptation to receptor, thus increasing the affinity[17]. More importantly, the digestion of Spike is an indispensable for membrane fusion of S2 part[18]. In this case, the efficiency of the SARS-CoV-2Spike protein cleavage is significantly higher than that of SARS-CoV, and the SARS-CoV-2Spike protein could be cut during the process of virus maturation (Figure 3). The receptor affinity and membrane fusion efficiency of SARS-CoV-2 would be significantly enhanced compared to that of SARS-CoV. The membrane fusion of SARS-CoV-2Spike protein is more likely to occur during endocytosis process. This may explains the current strong infectious capacity of SARS-CoV-2. So, the development of furin inhibitors may be a promising approach to block its transmissibility.

Figure1.Evolutionary relationships of taxa.The evolutionary history was inferred using the Neighbor-Joining method. The bootstrap consensus tree inferred from 500 replicates is taken to represent the evolutionary history of the taxa analyzed. Branches corresponding to partitions reproduced in less than 50% bootstrap replicates are collapsed. The evolutionary distances were

page7image64081776

chinaXiv:202002.00062v1

computed using the Poisson correction method and in the units of the number of amino acid substitutions per site. The analysis involved 155 amino acid sequences. All positions containing gaps and missing data were eliminated. There are a total of 711 positions in the final dataset. Evolutionary analyses were conducted in MEGA7. Those painted in red mean containing cleavage site in sequences and those painted in yellow mean no cleavage site in sequences.

Figure 2.Sequence analysis of Spike protein in SARS-CoV-2. It contains an N-terminal signal peptide, S1 and S2. S1 contains N-terminal domain and receptor binding region. And S2 is mainly responsible for membrane fusion. The C-terminal region of S2 is S2′, it contains a fusion peptide, HR1, HR2, and a transmembrane domain, the amino acid sequence numbers of every domain are annotated below them. Cleavage sites contained in SARS-CoV and SARS-CoV-2 are marked by rhombus.

Figure 3.A schematic diagram of the process of SARS-CoV and SARS-CoV-2 infecting host cells.Those protease are presented by sector in different colors. Furin can cleaveSpike in the process of viral maturation.

page8image64776144
page8image64775936

chinaXiv:202002.00062v1

Table 1.Furin cleavage probability of Spike sequence homology

page9image53638656
page9image47685616
page9image53640192
page9image47684384
page9image47682480

Description SARS-CoV-2 Bat-CoV-RaTG13 Bat-SL-CoV SARS-CoV Bat-CoV HKU5 MERS-CoV Rat-CoV

MHV
HCoV-HKU1 Rodent-CoV Beta-CoVsp Equine-CoV Porcine-CoV Bovine-CoV Canine-CoV Camel-CoV HKU23 Rabbit-CoV HKU14 Human-CoV OC43

Accession no.

QHR63250.1 QHR63300.1 AVP78042.1 ABF68955.1 AGP04941.1 QBM11737.1 AFG25760.1 ABS87264.1 AGT17758.1 ATP66727.1 AYR18670.1 BAS18866.1 ARC95227.1 QGW57589.1 ABG78748.1 ALA50080.1 AFE48805.1 AMK59677.1

CS1 sequence

NSPRRAR/SV QTQTNSR/SV HTASILR/ST QLTPAWR/IY PSARLAR/SD LTPRSVR/SV TAHRARR/SV TSHRARR/SI SSRRKRR/GI TARRKRR/AL ATRRAKR/DL TARRQRR/SP TSLRSRR/SL TKRRSRR/AI TQRRSRR/SI IDRRARR/FT TLQPSRR/AI KTRRSRR/AI

FurinscoreIdentityb

0.620 100% 0.151 97.4% 0.170 80.3% 0.117 76.0% 0.697 37.1% 0.563 35.0% 0.879 36.3% 0.861 36.9% 0.744 36.8% 0.795 37.3% 0.753 35.9% 0.815 37.1% 0.758 36.1% 0.780 37.5% 0.832 37.1% 0.718 36.5% 0.629 37.7% 0.720 36.8%

page9image53477568
page9image47702112
page9image53487360
page9image47695504
page9image47705024
page9image53488512
page9image47694048
page9image53487552
page9image47694272
page9image47696288

aScores are predicted by ProP 1.0 Server. Scores above 0.5 mean furin cleavable. bIdentities compared with SARS-CoV-2 Spike protein.

3.2 Homology modeling and protein-protein docking calculation

In our previous studies (accepted by ActaPharmaceuticaSinica B), both SARS and SARS-CoV-2 spike RBD structures have been docked with human ACE2 to calculate their binding free energy. In that time, the complex structure of SARS-CoV-2 RBD with ACE2 was not available.Its energy was calculated based on the homology model generated from

chinaXiv:202002.00062v1

SARS_RBD-ACE2 complex. The binding energy between the SARS-CoV-2 spike RBD and human ACE2 was -33.72 kJ mol-1, and that between SARS-CoV spike RBD and ACE2 was -49.22 KJ mol-1.This means the binding affinity between SARS-CoV-2 spike and ACE2 is weaker than that of SARS spike. During this manuscript was prepared, the structure of SARS-CoV-2 spike RBD-ACE2 complex was disclosed[19]. Based on this new real structure of SARS-CoV-2 spike RBD-ACE2 complex, we re-did the calculation and found that the binding free energy between SARS-CoV-2 spike RBD and ACE2 was -50.13 KJ mol-1 (Figure S3). This means the binding affinity between SARS-CoV-2 spike and ACE2 is slightly stronger than that of SARS spike.By inspecting the crystal structure of SARS-CoV-2 RBD-ACE2 complex and SARS RBD-ACE2 complex, one can find that one key loop of SARS-CoV-2 RBD in the complex interface had very different conformation compared to that of SARS RBD and previous modeled SARS-CoV-2 RBD (Figure S4).

In order to further explore the possible mechanism how furin cleaves SARS-CoV-2 Spike, we perform protein-protein docking for furin and Spike. Although a Cryo-EM structure of SARS-CoV-2 Spike has been published in bioRxiv during this manuscript was prepared[20], the PDB coordinate was still not available so far. We already built a homology model of SARS-CoV-2 Spike in our previous paper submitted to another regular journal. SARS-CoV-2 Spike structure was built by using the SARS-CoVSpike structure as the temple (PDB code: 5X58)[21]. By superimposing the SARS-CoVSpike with the SARS-CoV-2 Spike, we can find that the major conformation differences between two structures are RBD domain, Arg685/677 loop region(furin/trypsin/TMPRSS2 cut site) and S2 loop region just after fusion peptide (Figure 4A).The trypsin/TMPRSS2 cut site of SARS-CoV was disordered and missing from the original Cryo-EM structure possibly due to its flexibility and without electro density. The “PRRA” inserting in SARS-CoV-2 in this region apparently generate the more flexible loop region and accessible cut site for protease. We performed protein-protein docking by setting SARS-CoV-2 Spikefurincleavage loop as the receptor, and furin active pocket as the ligand. The protein-protein docking results showed that furin acidic/negative active pocket can be well fitted onto the SARS-CoV-2 Spikebasic/positive S1/S2 protease cleavage loop with low energy (-18.43 Kcal/mol). This implies that the extra “PRRAR” loop of SARS-CoV-2 Spike renders it more fragile to the protease. And this may allow this site to be cut during the maturation, efficiently

chinaXiv:202002.00062v1

enhancing the infection efficiency.

Figure 4.Protein-protein docking model of SARS-CoV-2 Spike with furin. (A) Superimposition of SARS-CoVSpike and SARS-CoV-2 Spike. Two S1/S2 protease cleavage sites and fusion peptide were shown as electrostatic surface mode. (B) Furin was docked onto the putative furin cut site (Arg685) of SARS-CoV-2 Spike. Both domains are shown as electrostatic surface mode.

3.3. Virtual ligand screening of furin protein

Structure-based virtual ligand screening method was used to screen potential furin protein inhibitors through ICM 3.7.3 modeling software (MolSoft LLC, San Diego, CA) from a ZINC Drug Database (2924 compounds), a small in-house database of natural products (including reported common antiviral components from traditional Chinese medicine) and derivatives (1066 compounds), and an antiviral compounds library contains 78 known antiviral drugs and reported antiviral compounds. Compounds with lower calculated binding energies (being expressed with scores and mfscores) are considered to have higher binding affinities with the target protein.

page11image64779264

chinaXiv:202002.00062v1

The screening results for the ZINC Drug Database (Table 2) showed that anti-tumor drugs Aminopterin, Fludarabine phosphate and Irinotecan, antibacterial drugs Sulfoxone,Lomefloxacinand Cefoperazone,antifungaldrug Hydroxystilbamidine, antivirus drugValganciclovir,hepatoprotective drugSilybin,folic acid supplementFolinic acid have higher binding affinity to furin with mfscores lower than -100 or Scores lower than -30.

Here, we show one example of screen hits, Hydroxystilbamidine, which was predicted to bind in the active site of furin with low binding energy. In the generated docking model, Hydroxystilbamidine was well fitted into the binding pocket of the substrate and adopted similar conformation as substrate analogous inhibitor MI-52 in PDB model 5JXH[22],occupied two arms’ position of MI-52 (Figure 5A). Asp159, Asp259 and Asp306 were predicted to form three hydrogen bonds with imine groups of compounds (Figure 5B). It looks like that Hydroxystilbamidine mimic at least two arginines. Weak hydrophobic interaction between His194, Leu227, the backbone of Trp254 and Asn295 with the compound may further stabilize its conformation.

Table 2. Potential furin inhibitors from ZINC drug database

page12image53850880
page12image53838592
page12image53850496

No.

Drug Name

Structure

Pharmacological functions

page12image48019792
page12image53853376
page12image53848576
page12image53849536
page12image47995120
page12image53849344
page12image53848768
page12image53852800
page12image48082752
page12image53849152
page12image53850688
page12image48088496
page12image53853568
page12image48087264
page12image63597440
page12image63597248
page12image47195552
page12image47197456
page12image63596096
page12image63595904
page12image63595520
page12image63595328
page12image63602432
page12image63602240

1

Aminopterin

Anti-tumor

page12image63597824
page12image47295648
page12image53775936
page12image53800768
page12image47293408
page12image63585472
page12image63585088
page12image47291616
page12image63583360
page12image47305536
page12image63583744
page12image63583552
page12image63582976
page12image63582784
page12image63581632
page12image63582592
page12image63582400
page12image47307328
page12image63581440
page12image63581248
page12image47306656
page12image63580096
page12image63579520
page12image63579904
page12image47305984
page12image63574528
page12image63574336
page12image47316624
page12image63573376
page12image47315616
page12image63578944
page12image63578752
page12image47556336
page12image47556560
page12image53847040
page12image53853952
page12image53851648
page12image53845120
page12image53843968
page12image53843200
page12image53758016
page12image53757056
page12image53757248
page12image53757440
page12image53758784
page12image47558912
page12image47559360

2

Folic acid

Vitamin B9, necessary material for the growth and reproduction of body cells

page12image63929536
page12image63929344
page12image47599888
page12image63928384
page12image63928192
page12image63928000
page12image63927808
page12image63927616
page12image63927424
page12image47600784
page12image63926656
page12image63926464
page12image63925312
page12image63925120
page12image53841088
page12image53843776
page12image53844544
page12image53847232
page12image48052000
page12image53840128
page12image53839744
page12image53847424
page12image53839168
page12image53840704
page12image53839552
page12image48051664
page12image48038672
page12image48064240
page12image53845504
page12image53845312
page12image48148848
page12image53845696
page12image48146608

3

Sulfoxone

Antibacterial effect

page12image47737568
page12image53756096
page12image47266240
page12image63485440
page12image47248736
page12image63486016
page12image63487168
page12image63484672
page12image63576832

chinaXiv:202002.00062v1

page13image47673376
page13image63502400
page13image63501056
page13image63500096
page13image63499904
page13image47665312
page13image63497984
page13image47662848
page13image63494912
page13image47667440

4

Silybin

page13image63490688
page13image63490496
page13image63488000
page13image47709056
page13image47697184
page13image63576448
page13image63579328
page13image63600128
page13image63599552
page13image63600896
page13image63599360
page13image53759360
page13image53759168
page13image53758208
page13image63537728
page13image63537536
page13image48807936
page13image63538496
page13image63539072
page13image48808048
page13image48808160
page13image63545984
page13image63543488
page13image63544640
page13image63543680
page13image63545408
page13image63542336
page13image63548288
page13image63546944
page13image63547520
page13image63545216
page13image63549632
page13image63551360
page13image48808272
page13image63539456
page13image63550400
page13image48809280
page13image63553280
page13image48809392
page13image63548864
page13image63552704
page13image63550208

Fludarabine phosphate

Hepatoprotective effect

page13image48810176
page13image63550016
page13image63552512
page13image63610368

5

Diminazene

Insecticidal effect

page13image48811296
page13image63608448
page13image63609216
page13image63608640

6

Anti-tumor

page13image48812080
page13image63834176
page13image63833984
page13image48812192
page13image63848192
page13image63847616
page13image63847424
page13image63847232
page13image48812304
page13image63846272
page13image63845888
page13image63845696
page13image63845504
page13image63845312
page13image63844928
page13image63844736
page13image48812416
page13image63843968
page13image63843776
page13image63843584
page13image63843392
page13image63843200
page13image63842816
page13image63842624
page13image63842432
page13image48812528
page13image63841472
page13image63841280
page13image63841088
page13image48812864

7

L-Arginine

Nutritional supplement

page13image63838976
page13image63838784
page13image63838592
page13image63838400
page13image63838208
page13image63838016
page13image63837824
page13image63837632
page13image63837440
page13image63837248
page13image48813984
page13image63836672
page13image63836480
page13image63836288
page13image63836096
page13image63835904
page13image63835328
page13image63835136
page13image63834944
page13image48814096
page13image63832448
page13image63832064
page13image63834368
page13image63849600
page13image48814208
page13image63852480
page13image63853056
page13image63852288

8

Hydroxystilbamidine

Antifungal effect

page13image63864576
page13image63864384
page13image63864192
page13image63864000
page13image63863808
page13image63863616
page13image48815328
page13image63862464
page13image63862272
page13image63862080
page13image63861888
page13image63861696
page13image63861120
page13image63860928
page13image63860736
page13image48815440
page13image63859392
page13image48812752
page13image63863424
page13image63863232
page13image63857472
page13image48812640
page13image63857088
page13image63854976
page13image63854016
page13image48815552
page13image48815664
page13image63944000
page13image63943424
page13image63943232
page13image63941504

9

Methotrexate

Antineoplastic, antirheumatic effects

page13image63943040
page13image63942848
page13image48816896
page13image63941888
page13image63941696
page13image63941312
page13image63941120
page13image63940928
page13image63940736
page13image63940544
page13image48817008
page13image63935936
page13image63939776
page13image63939584
page13image48817120
page13image63938624
page13image63938432
page13image63938240
page13image48817232
page13image63937472
page13image63936896
page13image48817344

10

L-dopa

Treatment of Parkinson’s disease

page13image63932288
page13image63930752
page13image63931328
page13image63931136
page13image48818576
page13image63932096
page13image63931904
page13image63930944
page13image48818688
page13image48818800
page13image48818912
page13image63961344
page13image48819136
page13image63959808
page13image63959616
page13image48819248
page13image48819360
page13image63950592
page13image48819472
page13image63948672
page13image63948480
page13image63948096
page13image63947904
page13image48819584

11

Irinotecan

Anti-tumor

page13image48792000
page13image63475648
page13image63475456
page13image63475264
page13image63474880
page13image63473920
page13image63473728
page13image63473152
page13image63472960

chinaXiv:202002.00062v1

page14image47611904
page14image63907008
page14image63950016
page14image63949440
page14image63960384
page14image48820480
page14image63859584
page14image48820592
page14image63865216
page14image63865408
page14image63865600
page14image63865792
page14image48820704
page14image63866560
page14image63866752
page14image63866944
page14image63867136
page14image63867328
page14image63867520
page14image48820816
page14image63873088
page14image63873280

12

Cefoperazone

page14image63873472
page14image63873664
page14image63873856
page14image48821600
page14image48821712
page14image63875776
page14image63875968
page14image63876160
page14image63876352
page14image63876544
page14image48821824
page14image63877120
page14image48821936
page14image63908352
page14image63908928
page14image63909120
page14image63909312
page14image47612688
page14image63910080
page14image63910272
page14image63910464
page14image63910656
page14image63910848
page14image47613024
page14image63911616
page14image47612240
page14image63783104
page14image63783296
page14image47614368
page14image63785216
page14image63785408
page14image63785600
page14image47612800
page14image47541856
page14image47578432
page14image63789824
page14image63790016
page14image63790208
page14image63790400
page14image63790592
page14image63790784
page14image47574848
page14image63791360
page14image63791552
page14image63791744
page14image63791936
page14image63792512
page14image63792704
page14image63792896
page14image63793088
page14image47571488
page14image63793856
page14image63794048
page14image63794240
page14image63794624
page14image47547264
page14image63795968
page14image63796160
page14image63796352
page14image63796544
page14image63796736
page14image63796928
page14image63797120
page14image63797312
page14image63797504
page14image63797696
page14image63797888
page14image63798080
page14image47469600
page14image63798848
page14image47469152
page14image63766720
page14image47470048
page14image47468928
page14image63768640
page14image63768832
page14image63769024
page14image63769216
page14image63769408
page14image47464448
page14image63770176
page14image47472848
page14image63771520
page14image63771904
page14image47468480
page14image63772672

Valganciclovir

Antibacterial effect

page14image47468592
page14image63773440
page14image63773632
page14image63774208
page14image63774400

13

Folinic acid

Folic acid supplement

page14image47511440
page14image63775360
page14image63775552
page14image47507632
page14image63776128
page14image63776512
page14image63776704
page14image63776896

14

Glycerol 3-phosphate

Intermediate for serine synthesis

page14image47506624
page14image63777856
page14image63778048
page14image63440384

15

Antivirus

page14image63438848
page14image48836528
page14image63443840
page14image63444224
page14image63444416
page14image63444608
page14image63444800
page14image63444992
page14image63445184
page14image48825552
page14image63779200
page14image63779392
page14image63779584
page14image63779776
page14image63780352
page14image63780544
page14image63780736
page14image48972672
page14image63781696
page14image63781888
page14image63782080
page14image48973904
page14image63818752
page14image63818944
page14image63819136
page14image48973120
page14image63821248
page14image63821824
page14image63822400
page14image63822592

16

Fosaprepitant

Treatment of nausea and vomiting induced by chemotherapy

page14image48826896
page14image63446528
page14image48838320
page14image63447296
page14image63447488
page14image63447680
page14image48824544
page14image63448640
page14image63448832
page14image48838208
page14image63449984
page14image63450176
page14image48825328
page14image63450944
page14image63451136
page14image63451328
page14image48840224
page14image63822976
page14image48837312
page14image63452864
page14image63453056
page14image63453248
page14image63453440
page14image63453632
page14image63877696
page14image63877888
page14image63878080
page14image48972560
page14image48974576
page14image48974352
page14image63824896
page14image63825088
page14image63825280
page14image48972448
page14image48973008
page14image63828736
page14image63828928
page14image63829120
page14image63829312
page14image63829504

17

Lomefloxacin

Antibacterial effect

page14image63829696
page14image63829888
page14image49020672
page14image49018992
page14image63831040
page14image63831232
page14image63831424
page14image63831616
page14image63454016
page14image48839888
page14image63454784
page14image63454976
page14image63799296
page14image48834064
page14image63800256
page14image63800448
page14image63800640
page14image48833280
page14image63801600
page14image48837872
page14image63803328
page14image63803520
page14image63803712
page14image48834176
page14image63804864
page14image63805056
page14image63805248
page14image48839552

18

Glutathione

Hepatoprotective effect

page14image63831808
page14image63717376
page14image48895680
page14image63718144
page14image63718336
page14image63718528
page14image63718720
page14image63719104
page14image63719296
page14image63719488
page14image63719680
page14image63719872
page14image63720064
page14image63722560

chinaXiv:202002.00062v1

19Famotidine                           Treatment of gastrohelcosis
20Imatinib                      Anti-tumor
21Chenodeoxycholic acid                             Dissolving gallstones
page15image64088224

Figure 5.Low-energy binding conformations of Hydroxystilbamidine bound to furin generated by molecular docking. (A) Hydroxystilbamidinewas fitted well in the active pocket of human furin, and furin was shown as electrostatic surface model. Hydroxystilbamidine (yellow) was overlapped with substrate analogue inhibitor MI-52 (purple).(B) Detailed view of Hydroxystilbamidinebinding in the activepocket of furin.

chinaXiv:202002.00062v1

Another example was anticancer drug Imatinib. It was also predicted to bind in the active site of furin. In the generated docking model, Imatinib was fitted well in the binding pocket, and occupied the top two arms’ position of MI-52 (Figure 6A). Two hydrogen bonds were predicted to form between the compound with Glu236 and Gly255. Weak hydrophobic interaction between Val231, Pro256, Trp254 and Gly294 and the compound was found (Figure 6B).

Figure 6. Low-energy binding conformations of Imatinibto furin generated by molecular docking. (A) Imatinibwas fitted well in the active pocket of human furin, and furin was shown as electrostatic surface model. Imatinib (yellow) was overlapped with substrate analogue inhibitor MI-52 (purple).(B) Detailed view of Imatinibbinding in the activepocket of furin.

page16image64176960

chinaXiv:202002.00062v1

Table 3.Potential furin inhibitors from in-house natural product database

No.Drug NameStructurePharmacological functionsSource
1(-)-Epigallocatechin gallate                           Antioxidation, anti-tumor, treatment of depressionCamellia sinensis
2Theaflavin 3,3′-di-O-gallate                                           Antioxidant effect, anti-tumor, anti-virusCamellia sinensis
3Biorobin                                                      Anti-virusFicusbenjamina
414-deoxy-11,12- didehydroandrographiside                                    Anti-virus,anti-inflammatoryeffectAndrographispanicu lata
5(1S,2R,4aS,5R,8aS)-1- formamido-1,4a-dimethyl-6- methylene-5-((E)-2-(2-oxo-2,5- dihydrofuran- 3-yl)ethenyl) decahydronaphthalen-2-yl 5-((R)-1,2-dithiolan-3-yl) pentanoate                  Anti-virus,anti-inflammatoryeffectAndrographolide derivatives

chinaXiv:202002.00062v1

62β,30β-dihydroxy-3,4-seco-friedelolact one-27-lactone                      Anti-virusViola diffusa
7Phyllaemblicin G7                                              Anti-virusPhyllanthusemblica
8Andrographolide                          Anti-virus,anti-inflammatoryeffectAndrographispanicu lata
914-deoxy-11,12- didehydroandrographolide                        Anti-virus,anti-inflammatoryeffectAndrographispanicu lata
10(1S,2R,4aS,5R,8aS)-1- formamido-1,4a-dimethyl-6- methylene-5-((E)-2-(2-oxo-2,5- dihydrofuran-3-yl)ethenyl) decahydronaphthalen-2-yl 2-aminoacetate                               Anti-virus,anti-inflammatoryeffectAndrographolide derivatives
112-[[2-O-(6-deoxy-α-L-mannopyranosyl )-β-D-xylopyranosyl]oxy]-1,8-dihydro xy-6-methoxy-9H– xanthen-9-one                                      Anti-virus,anti-inflammatoryeffectSwertiakouitchensis
12Kouitchenside JAnti-virus, anti-inflammatory effectSwertiakouitchensis

chinaXiv:202002.00062v1

13Stigmast-5-en-3-ol          Antioxidant effectSpatholobussuberect usdunn
14Kouitchenside F                                              Anti-virus,anti-inflammatoryeffectSwertiakouitchensis

For the natural products (Table 3), a series of compounds with antivirus and anti-inflammation effects, such as (-)-Epigallocatechin gallateand Theaflavin 3,3′-di-O-gallatefromCamellia sinensis,Biorobin from Ficusbenjamina, Andrographolide and 14-deoxy-11,12-didehydroandrographiside from Andrographispaniculata, one Andrographolide derivative (1S,2R,4aS,5R,8aS)-1- formamido-1,4a-dimethyl-6-methylene-5-((E)-2-(2-oxo-2,5-dihydrofuran-3-yl)ethenyl)decahydro

naphthalen-2-yl 5-((R)-1,2-dithiolan-3-yl)pentanoate, 3,4-seco-friedelolactone-27-lactone from Viola
G7fromPhyllanthusemblica, xanthones2-[[2-O-(6-deoxy-α-L-mannopyranosyl)-β-D-xylopyranosyl]oxy]-1,8-dihydroxy-6-meth oxy-9H-xanthen-9-one, Kouitchenside J and Kouitchenside Ffrom Swertiakouitchensisexhibited high binding affinity to furin protein (mfscores< -100), suggesting the potential utility of these compounds in the treatment of SARS-CoV-2.

(-)-Epigallocatechin gallate (EGCG) was predicted to bind in the active site of furin, as Imatinib, it occupied the top two arms’ position of MI-52 (Figure 7A). Two hydrogen bonds were predicted formed between the compound with Asp258 and Ala292. Weak hydrophobic interactions between Pro256, Trp254 and Gly294 and the compound were predicted (Figure 7B).

diffusa,

2β,30β-dihydroxy- Phyllaemblicin three

chinaXiv:202002.00062v1

page20image64776976

Figure 7. Low-energy binding conformations of ECCG to furin generated by molecular docking. (A) ECCGwas fitted well in the active pocket of human furin, and furin was shown as electrostatic surface model. ECCG (yellow) was overlapped with substrate analogue inhibitor MI-52 (purple).(B) Detailed view of ECCG binding in the activepocket of furin.

The database of 78 antiviral drugs including compounds already on the market and currently undergoing clinical trials to treat SARS-CoV-2 infections was further screened. The results were shown in Table 4. DNA topoisomerase II inhibitorSuramin treating hand-foot-and-mouth disease exhibited the highest affinity with furin (mfscore = 190.406). A series HIV-1 therapeutic drugs, such as Indinavir, Tenofoviralafenamide, TenofovirDisoproxil and Dolutegravir, and hepatitis C therapeutic drugs, Boceprevir and Telaprevir also have high binding affinity to furin.

Suramin was predicted to bind in the active site of furin with high binding mfScores. From generated docking model, Suramin occupied the top right arm and bottom arm positions of MI-52, it extended more to another adjacent pocket and covered almost all the surface areas for furin substrate binding (Figure 8A). Asp154, Asp228, Gly229, Ser253, Asp264, Glu271, Ile312, Lys449,

chinaXiv:202002.00062v1

Arg490 and Asp530 were predicted to form 10 hydrogen bonds with the compound. Weak hydrophobic interactions may form between His194, Leu227, Tyr308, Trp531 and A532 with the compound (Figure 8B).

Table 4.Potential furin inhibitors from the common antiviral drugs database

page21image49168240
page21image63321792
page21image63322944
page21image63323136
page21image63323328

No.

Drug Name

page21image63323712
page21image63323904
page21image49169280
page21image63341312
page21image63341504
page21image49169392
page21image63342848
page21image63343040
page21image63343232
page21image63343424
page21image63343616
page21image63343808
page21image63344000
page21image63344192
page21image63344384
page21image63344576
page21image63344768
page21image63344960
page21image63345152
page21image63345344
page21image63345536
page21image63345728
page21image63345920
page21image63346112
page21image63346304
page21image63346496
page21image63346688
page21image63346880
page21image63347072
page21image63347264
page21image63347456
page21image63347648
page21image63347840
page21image63348032
page21image63348224
page21image49169504
page21image49169616
page21image63349184
page21image63349376
page21image63349568
page21image63349760
page21image63349952
page21image63350144
page21image63350336
page21image63350528
page21image63350720
page21image63350912
page21image63351104
page21image63351296
page21image63351488
page21image63351680
page21image63351872
page21image63352064
page21image63352256
page21image63352448
page21image63352640
page21image63352832
page21image63353024
page21image63353216
page21image63353408
page21image63353600
page21image49169728
page21image49169840
page21image49169952
page21image49170064
page21image63356288
page21image63356480
page21image49171184

Suramin

Structure

Pharmacological functions

page21image49172304
page21image63243008
page21image63243200
page21image49172416
page21image63244160
page21image63244352

1

DNA topoisomerase II inhibitor

page21image63244736
page21image63244928
page21image63245120
page21image63245696
page21image49173312
page21image49173424
page21image63247424
page21image63247616
page21image63247808
page21image63248000
page21image63248192
page21image63248384
page21image63248960
page21image63249152
page21image63249344
page21image49173760
page21image63249920
page21image63250112
page21image63250880
page21image63251072
page21image63251264
page21image63251456
page21image49173984
page21image63252224
page21image63252416
page21image63252608
page21image63252800
page21image63252992
page21image63253184
page21image63253376
page21image63253568
page21image63253760
page21image63253952
page21image63254144
page21image63254336
page21image63254528
page21image63255104
page21image49174096
page21image63255872
page21image63256064
page21image63256256
page21image49174208
page21image63257216
page21image63257408
page21image63257600
page21image63257984
page21image49174320
page21image63296960
page21image63297152
page21image49174432
page21image49174544
page21image63300800
page21image63300992
page21image63301184
page21image63301568
page21image63301760
page21image49174656

2

Indinavir

Human immunodeficiency virus Protease (HIV PR)

page21image63338752
page21image48788048
page21image63258624
page21image49247696
page21image49241760
page21image63261120
page21image63261312
page21image63261504
page21image63261696
page21image63261888
page21image63262464
page21image63262656
page21image63262848
page21image49249936
page21image49244784
page21image48803200
page21image48797040
page21image48795584
page21image63266496
page21image48799504
page21image63340288
page21image48788160
page21image63275584
page21image63275776
page21image63275968
page21image48788272
page21image63276928
page21image63277504
page21image63277696
page21image63277888
page21image63278080

3

Boceprevir

Hepatitis C virus Serine protease NS3/4A (HCV NS3/4A) Modulator

page21image49184992
page21image63378688
page21image63378880
page21image63379072
page21image63379264
page21image63379456
page21image63379648
page21image63379840
page21image63380032
page21image49185104
page21image63381376
page21image63381568
page21image63381760
page21image63381952
page21image49185216
page21image63382720
page21image49185328
page21image63303488
page21image63303680
page21image63303872
page21image63304064
page21image63304256
page21image63304832
page21image63305024
page21image63305216
page21image63305600
page21image63305792
page21image63278272
page21image63266880
page21image63267072
page21image63267264
page21image63267456
page21image63267648
page21image48797600
page21image63268608
page21image48796816
page21image63269376
page21image63269568
page21image48801072
page21image48804992
page21image63271296
page21image48808944
page21image63272448
page21image63272640
page21image63273024
page21image63273216
page21image48823280

4

Tenofoviralafenamide

HIV-1 nucleotide reverse transcriptase inhibitor

page21image63383296
page21image63383488
page21image63384064
page21image63384256
page21image49186560
page21image63384832
page21image63385024
page21image49186672
page21image63385600
page21image49186784
page21image63386176
page21image49186896
page21image49187008
page21image63388672
page21image63388864
page21image63389056
page21image49187120
page21image63193472
page21image63193664
page21image63193856
page21image63194240
page21image63194432
page21image63194624
page21image49187232
page21image63195200
page21image63305984
page21image63306176
page21image63306368
page21image63306560
page21image63306752
page21image63306944
page21image63307136
page21image63307328
page21image63307520
page21image63176704
page21image63176896
page21image63177088
page21image63177280
page21image63177472
page21image63177664
page21image63177856
page21image49176112
page21image63178432
page21image63178624
page21image63178816
page21image63179008
page21image63179200
page21image63179392
page21image63179584
page21image63179776
page21image63179968
page21image63180160
page21image63180352
page21image63180544
page21image49176224
page21image49176336

5

TenofovirDisoproxil

HIV, HBV nucleotide reverse transcriptase inhibitor

page21image63181504
page21image63181696
page21image49177680
page21image63182464
page21image49177792
page21image49177904
page21image63184384
page21image63184576
page21image63184768
page21image63184960
page21image63185152
page21image63185344
page21image63185536
page21image49178016
page21image63186304
page21image63186496
page21image63186688
page21image49178128
page21image63187648
page21image63187840
page21image63188032
page21image63188416
page21image63188992
page21image63189184
page21image63189376
page21image49176000
page21image63190720
page21image63190912
page21image63191104
page21image63191296
page21image63191488
page21image63191680
page21image63191872
page21image63192064
page21image49175888
page21image63226048
page21image63226240
page21image63226432
page21image63226624
page21image49178240
page21image63227200
page21image63227392
page21image63227584
page21image63227776
page21image63227968
page21image63229312
page21image63229504
page21image63229696
page21image63229888
page21image63230080
page21image63230272

6

Acycloguanosine triphosphate

Thymidine kinase of herpesvirus

page21image63230464
page21image63230656
page21image63230848
page21image63231040
page21image63231232
page21image49179584
page21image63232000
page21image63232192
page21image63232384
page21image49180032
page21image49180144
page21image63240064

chinaXiv:202002.00062v1

7Telaprevir                                                Hepatitis C virus Serine protease NS3/4A (HCV NS3/4A) Modulator
8Dolutegravir                           Human immunodeficiency virus Integrase (HIV IN)
9Maraviroc                                          1.C-C chemokine receptor type 5 (CCR5) 2.CCR5 messenger RNA(CCR5 mRNA)
10Cobicistat                                                         Inhibitor of cytochrome P450 3A (CYP3A) enzymes
11Stavudine triphosphate                                          Nucleoside analogue reverse transcriptase inhibitor used in the treatment of HIV infection

chinaXiv:202002.00062v1

page23image64029088

Figure 8.Low-energy binding conformations of Suraminto furin generated by molecular docking. (A) Suraminwas fitted well in the active pocket of human furin, and furin was shown as electrostatic surface model. Suramin (yellow) was overlapped with substrate analogue inhibitor MI-52 (purple).(B) Detailed view of Suraminbinding in the activepocket of furin.

chinaXiv:202002.00062v1

4. Discussion

Our previous study(accepted by ActaPharmaceuticaSinica B) analyzed the amino acid composition of the RBD domain of the ACE2 receptor of SARS-CoV-2 and Bat-CoVRaTG13. We found that several key amino acids determining binding were mutated in SARS-CoV-2, which are more similar tothat of SARS-CoV.The calculation results show that in the same conformation as the SARS-CoV protein, the binding energy of SARS-CoV-2 and ACE2 receptors was a litter higher, but this result cannot fully explain the epidemiologically high contagion, so we speculate (1)the RBD domain of SARS-CoV-2 may have other conformations; (2) there may be other receptors; and (3) there are other mechanisms that enhance infectivity. During this manuscript was prepared, the Cryo-EM structure of SARS-CoV-2 Spike was solved[20]. Comparing thestructure of SARS-CoV-2 with the Spike structure of SARS-CoV, combined with biophysical detection, they found that SARS-CoV-2 binds more strongly to cellular ACE2 receptors. Furthermore, the just disclosed crystal structure of SARS-CoV-2 RBD-ACE2 complex showed a distinct conformational change in the key loop of complex binding interface. And the binding free energy calculation indicated a slightly stronger binding for SARS-CoV-2 RBD compared to that of SARS RBD. These results confirm our guess that the conformational change of the RBD domain of SARS-CoV-2 leads to stronger binding. However, stronger receptor binding still can’t fully explain the more infectious problem.

So we put forward these hypotheses: (1) SARS-CoV-2 can also bind to other receptors; (2) the lung may not be the earliest infection site; (3) SARS-CoV-2 is easier to cut and more easily fuse with cell membranes. Published in the Pubmed database, researchers performed RNA-seq analysis on tissue samples from 95 individuals’ 27 different tissues. The results showed that ACE2 protein was highly expressed in the small intestine and duodenum, but the expression level in lung tissue is low (Figure S5). However, we analyzed the expression of furin and found that it is distributed in various organs with little difference in expression level. Combined with the possible infection mechanism of SARS-CoV-2, the widespread distribution of furin increases the SARS-CoV-2 infection of other organs. The possibility of other organ attack is consistent with the multiple symptoms observed in clinic of COVID-19.

Based on these three conjectures, we compared the Spike sequences from SARS-CoV-2, SARS-CoV, MERS-CoV and Bat-CoVRaTG13, and found that anextra “PRRA”insert near the

chinaXiv:202002.00062v1

S1/S2 cleavage site. The “PRRA”insert and subsequent arginine (R) constitute a RRAR sequence that can be recognized and cleaved by furin-like proteases, which may be the reason why SARS-CoV-2 infection is stronger than SARS-CoV. What’s more, we performed a homologous alignment and phylogenetic analysis of the SARS-CoV-2 sequence, and found that “PRRA”insert did not appear at any other close relatives of SARS-CoV-2, indicating that this insertwas completely novel in this genus virus. The existence of such a motif may allow Spikes to be cut into S1 and S2 by furin-like proteases before maturity, but not separated, which provides S1 with the flexibility to change the conformation to better fit the host receptor. According to Simmons G et al. studies, overexpression of furin can increase the activity of SARS-CoVSpike, but it will not cause Spike to be cleaved [23].This is consistent with our prediction.

Furthermore, Glowacka Ietal.and Simmons Get al.studies have demonstrated that SARS-CoVSpikes can be activated by cleavage in two ways, including proteolytic activation by cathepsins B and L in host cells [24]. In addition, SARS-CoVSpike can be activated by TMPRSS2 cleavage on the host cell surface[6].What’s more, MERA-CoV, S1/S1 and S2’ cleavage sites cannot be cut by fruin[25].So we speculated that the activation of SARS-CoV-2 Spike can be through different protease cleavage pathways and these pathways can occur simultaneously in host cells. SARS-CoV-2 Spike can utilize host protease diversity to activate, which may explain the strong infectious capacity of SARS-CoV-2. As we can see in Figure 2, the Spike protein of SARS-CoV-2 can be cleaved at multiple stages, which greatly increases the efficiency of fusion. It is likely that the virus will fuse with the cell during endocytosis and release the genome. In addition, the binding ability of the cleaved Spike to the ACE2 receptor is also greatly enhanced [26].

According to our study, furin-like proteases may be potential drug targets for anti-SARS-CoV-2 treatment. At present, some peptide inhibitors have been developed and have good effects [27, 28]. To search potential inhibitors of furin-like proteases, we screened potential compounds from a ZINC drug database (2924 compounds), a small in-house database of natural products (1066 compounds), and existing antiviral drugs library (78 compounds) withfurinby virtual ligand screening. From the ZINC Drug Database, we found a series of anti-tumor, antibacterial, antivirus,hepatoprotective drugs, such as Aminopterin, Fludarabinephosphate,Sulfoxone,Irinotecan, Hydroxystilbamidine, Lomefloxacin, Cefoperazone, Valganciclovir,Imatinib, etc. might be used as furin inhibitors. For the natural products, some

chinaXiv:202002.00062v1

flavonoids, diterpenoids, and steroids with antivirus and anti-inflammation effects, such as ECCG, Biorobin, Phyllaemblicin G7, Andrographolide and its derivatives, and xanthonesfrom the Swertiagenus, etc.exhibited high binding affinity to furin protein. From the database of 78 antiviral drugs, a series of HIV-1, hepatitis C, and hand-foot-and-mouth disease therapeutic drugs, such as Indinavir, Tenofoviralafenamide, Tenofovir, Disoproxil, Dolutdegravir, Boceprevir, Telaprevir and Suraminalso showed high binding affinity to furin. These potentialfurin inhibitors and medicinal plants containing these compounds as major constituents might be useful for the treatment COVID-19. The further experiments to verify their efficiency in viro and in vivo will be carried out in our future studies. What’s more, combined administration of targeting different SARS-CoV-2 proteases with furin inhibitors may be an effective therapeutic strategy.

ACKNOWLEDGEMENTS

We acknowledge support from National Mega-project for Innovative Drugs (grant number 2019ZX09721001-004-007), National Natural Science Foundation of China (NSFC) (grant number No.U1803122, 81773637, 81773594, U1703111).

chinaXiv:202002.00062v1

5. References

[1] Bosch BJ, van der Zee R, de Haan CA, Rottier PJ. The coronavirus Spike protein is a class I virus fusion protein: structural and functional characterization of the fusion core complex. J Virol 2003; 77: 8801-8811.
[2] Lu G, Wang Q, Gao GF. Bat-to-human: Spike features determining ‘host jump’ of coronaviruses SARS-CoV, MERS-CoV, and beyond. Trends in Microbiology 2015; 23: 468-478.

[3] Xu X, Chen P, Wang J, Feng J, Zhou H, Li X, Zhong W, Hao P. Evolution of the novel coronavirus from the ongoing Wuhan outbreak and modeling of its Spike protein for risk of human transmission. Sci China Life Sci 2020.https://doi.org/10.1007/s11427-020-1637-5.
[4] Letko M, Munster V. Functional assessment of cell entry and receptor usage for lineage B β-coronaviruses, including 2019-nCoV. bioRxiv, 2020.https://doi.org/10.1101/2020.01.22.915660.

[5] Belouzard S, Chu VC, Whittaker GR. Activation of the SARS coronavirus Spike protein via sequential proteolytic cleavage at two distinct sites. Proc Natl Acad Sci U S A 2009; 106: 5871-5876.
[6] Glowacka I, Bertram S, Muller MA, Allen P, Soilleux E, Pfefferle S, Steffen I, Tsegaye TS, He Y, Gnirss K, Niemeyer D, Schneider H, Drosten C, Pohlmann S. Evidence that TMPRSS2 Activates the Severe Acute Respiratory Syndrome Coronavirus Spike Protein for Membrane Fusion and Reduces Viral Control by the Humoral Immune Response. Journal of Virology 2011; 85: 4122-4134.

[7] Zhou Y, Vedantham P, Lu K, Agudelo J, Carrion R, Jr., Nunneley JW, Barnard D, Pohlmann S, McKerrow JH, Renslo AR, Simmons G. Protease inhibitors targeting coronavirus and filovirus entry. Antiviral Res 2015; 116: 76-84.
[8] Kam YW, Okumura Y, Kido H, Ng LFP, Bruzzone R. Ralf AltmeyerCleavage of the SARS Coronavirus Spike Glycoprotein by Airway Proteases Enhances Virus Entry into Human Bronchial Epithelial Cells In Vitro. PLoS ONE 2009; 4: e7870.

[9] Feliciangeli SF, Thomas L, Scott GK, Subbian E, Hung CH, Molloy SS, Jean F, Shinde U, Thomas G. Identification of a pH sensor in the furin propeptide that regulates enzyme activation. J Biol Chem 2006; 281: 16108-16116.
[10] Henrich S, Cameron A, Bourenkov GP, Kiefersauer R, Huber R, Lindberg I, Bode W, Than ME. The Crystal Structure of the Proprotein Processing Proteinase Furin Explains Its Stringent Specificity. Nat Struct Biol 2003; 10: 520-526.

[11] Tay FP, Huang M, Wang L, Yamada Y, Liu DX. Characterization of cellular furin content as a potential factor determining the susceptibility of cultured human and animal cells to coronavirus infectious bronchitis virus

chinaXiv:202002.00062v1

page28image64029920

infection. Virology 2012; 433: 421-430.
[12] Yamada Y, Liu DX. Proteolytic activation of the Spike protein at a novel RRRR/S motif is implicated in furin-dependent entry, syncytium formation, and infectivity of coronavirus infectious bronchitis virus in cultured cells. J Virol 2009; 83: 8744-8758.
[13] Matsuyama S, Shirato K, Kawase M, Terada Y, Kawachi K, Fukushi S, Kamitani W. Middle East Respiratory Syndrome Coronavirus Spike Protein Is Not Activated Directly by Cellular Furin during Viral Entry into Target Cells. J Virol 2018; 92.
[14] Irwin JJ, Sterling T, Mysinger MM, Bolstad ES, Coleman RG. ZINC: A Free Tool to Discover Chemistry for Biology. Journal of Chemical Information and Modeling 2012; 52: 1757-1768.
[15] Abagyan R, Totrov M, Kuznetsov D. ICM-A New Method for Protein Modeling and Design_ Applications to Docking and Structure Prediction from the Distorted Native Conformation. J Comput Chem 1994; 15: 488-506 [16] Millet JK, Whittaker GR. Host cell proteases: Critical determinants of coronavirus tropism and pathogenesis. Virus Research 2015; 202: 120-134.
[17] Walls AC, Xiong X, Park Y-J, Tortorici MA, Snijder J, Quispe J, Cameroni E, Gopal R, Dai M, Lanzavecchia A, Zambon M, Rey FA, Corti D, Veesler D. Unexpected Receptor Functional Mimicry Elucidates Activation of Coronavirus Fusion. Cell 2019; 176: 1026-1039.
[18] Kirchdoerfer RN, Cottrell CA, Wang N, Pallesen J, Yassine HM, Turner HL, Corbett KS, Graham BS, McLellan JS, Ward AB. Pre-fusion structure of a human coronavirus Spike protein. Nature 2016; 531: 118-121. [19]http://nmdc.cn/?from=groupmessage#/resource/detail?no=NMDCS0000001
[20]Daniel Wrapp, Nianshuang Wang, Kizzmekia S. Corbett, Jory A. Goldsmith, Ching-Lin Hsieh, Olubukola Abiona, Barney S. Graham, View ORCID ProfileJason S. McLellan. Cryo-EM Structure of the 2019-nCoV Spike in the Prefusion Conformation. bioRxiv. 2020. https://doi.org/10.1101/2020.02.11.944462.
[21] Yuan Y, Cao D, Zhang Y, Ma J, Qi J, Wang Q, Lu G, Wu Y, Yan J, Shi Y, Zhang X, Gao GF. Cryo-EM structures of MERS-CoV and SARS-CoV Spike glycoproteins reveal the dynamic receptor binding domains.Nat Commun. 2017; 10:15092.
[22] Dahms SO, Arciniega M, Steinmetzer T, Huber R, Than ME. Structure of the unliganded form of the proprotein convertase furin suggests activation by a substrate-induced mechanism. Proc Natl Acad Sci 2016; 113:11196-11201.
[23] Simmons G, Bertram S, Glowacka I, Steffen I, Chaipan C, Agudelo J, Lu K, Rennekamp AJ, Hofmann H, Bates P, Pohlmann S. Different host cell proteases activate the SARS-coronavirus Spike-protein for cell-cell and

chinaXiv:202002.00062v1

virus-cell fusion. Virology 2011; 413: 265-274.
[24] Simmons G, Gosalia DN, Rennekamp AJ, Reeves JD, Diamond SL, Bates P. Inhibitors of cathepsin L prevent severe acute respiratory syndrome coronavirus entry. Proc Natl Acad Sci U S A 2005; 102: 11876-11881.
[25] Van Lam van T, Ivanova T, Hardes K, Heindl MR, Morty RE, Bottcher-Friebertshauser E, Lindberg I, Than ME, Dahms SO, Steinmetzer T. Design, Synthesis, and Characterization of Macrocyclic Inhibitors of the Proprotein Convertase Furin. ChemMedChem 2019; 14: 673-685.
[26] Parka J-E, Lib K, Barlana A, Fehrc AR, Perlmanb S, McCray PB Jr, Gallagher T. Proteolytic processing of Middle East respiratory syndrome coronavirus Spikes expands virus tropism.Proc Natl Acad Sci U S A 2016; 113: 12262–12267
[27] Dahms SO, Hardes K, Steinmetzer T, Than ME. X-ray Structures of the Proprotein Convertase Furin Bound with Substrate Analogue Inhibitors Reveal Substrate Specificity Determinants beyond the S4 Pocket. Biochemistry 2018; 57: 925-934.
[28] Dahms SO, Jiao GS, Than ME. Structural Studies Revealed Active Site Distortions of Human Furin by a Small Molecule Inhibitor. ACS Chem Biol 2017; 12: 1211-1216.

chinaXiv:202002.00062v1

Furin, a potential therapeutic target for COVID-19 Supplementary information

Figure S1. Multiple sequence alignment of 1000 Spike proteins. These 156 proteins were ranked according to their homology with SARS-2.The sequence corresponding to PRRA in SARS-CoV-2 in each sequence is marked in the red box.

page30image64033456

chinaXiv:202002.00062v1

page31image64187776

Figure S2. Result of furin cleavage site pridiction of Spike protein in SARS-CoV-2, which predicted by online method ProP 1.0 Server.

Figure S3. Protein-protein dockingcalculation model of SARS-CoV-2 spike RBD (light blue) with human ACE2 (yellow), original RBD conformation was shown in orange. The calculated free energy is -50.13 Kcal/mol.

page31image64186528

chinaXiv:202002.00062v1

page32image64186736

Figure S4. Comparison of SARS-CoV-2 spike RBD (orange) and SARS spike RBD (yellow). The complex with ACE2 (left part, yellow) was shown. The homology model of SARS-CoV-2 spike RBDbuilt from SARS spike RBD was shown as blue.

chinaXiv:202002.00062v1

page33image64034704

Figure S5. Expression levels of Furin, ACE2 and TMPRSS2 in various tissues. The data is from pubmed [1-3].

chinaXiv:202002.00062v1

References

[1] Angiotensin I converting enzyme 2 (ACE2) expression level in human tissues using HPA RNA-seq method. [DB/OL].(2020-02-03) [2020-02-17]. https://www.ncbi.nlm.nih.gov/gene/59272/?report=expression.
[2] Furin, paired basic amino acid cleaving enzyme (Fruin) expression level in human tissues using HPA RNA-seq method. [DB/OL].(2019-12-21) [2020-02-17]. https://www.ncbi.nlm.nih.gov/gene/5045/?report=expression.

[3] Transmembrane serine protease 2 (TMPRSS2) expression level in human tissues using HPA RNA-seq method. [DB/OL].(2019-12-21) [2020-02-17]. https://www.ncbi.nlm.nih.gov/gene/7113?report=expression.

chinaXiv:202002.00062v1

Posted in Most Recent | Leave a comment

Potential treatment of Chinese and Western Medicine targeting nsp14 of 2019-nCoV

Potential treatment of Chinese and Western Medicine targeting nsp14 of 2019-nCoV

Chao Liu 1, Xiaoxiao Zhu 1, Yiyao Lu 1, Xu Jia 1*, Tai Yang 2*

1 Non-coding RNA and Drug Discovery Key Laboratory of Sichuan Province, Chengdu Medical College, Chengdu, Sichuan, China
2 School of Pharmacy, Chengdu Medical College, Chengdu, Sichuan, China *Correspondence to: Xu Jia: jiaxu@cmc.edu.cn

Tai Yang: taiyang@cmc.edu.cn

chinaXiv:202002.00071v2

Abstract

2019 novel coronavirus (2019-nCoV) caused severe, large-scale acute respiratory disease outbreak in Wuhan, China. The 2019-nCoV has spread to other regions and countries around the world, which is seriously threatening human health. There is an urgent need to develop drugs for the prevention and treatment of 2019-nCoV. 2019- nCoV nonstructural protein 14 (NSP14) carrying RNA cap guanine N7- methyltransferase and 3′-5′ exoribonuclease activities could be a potential drug target for intervention. NSP14 of 2019-nCoV shared 98.7% similarity with the one (PDB ID: 5nfy) of acute respiratory syndrome (SARS) Coronavirus. Then, the 2019-nCoV NSP14 structures were modelled by using SARS NSP14 (PDB ID: 5nfy) as template for virtual screening. Based on the docking score, 18 small molecule drugs were selected for further evaluation. The compounds, including Saquinavir, Hypericin, Baicalein and Bromocriptine, could bind the N-terminus and C-terminus of the homology model of the 2019-nCoV Nsp14, thus providing as a candidate drug against 2019-nCoV for further study.

chinaXiv:202002.00071v2

1. Introduction

In December 2019, a large scale, severe acute respiratory disease named as “2019 novel coronavirus (2019-nCoV)” occurred in Wuhan, China, and has already spread to other regions of China and other countries around the world in the following one month, seriously threatening human health. There is an urgent demand to develop drugs for the prevention and treatment of 2019-nCoV. Coronavirus NSP plays an important role in the virus’ genome replication and transcription 1,2, and it is generally conserved as an important functional protein in the coronavirus family. Among the family, NSP14 protein has both exonuclease and methyltransferase functions, which is important for replication and transcription of SARS and other coronavirus, thus providing attractive target for drug designs 3-5.

The amino acid sequence alignment revealed that the NSP14 of 2019-nCoV shared 98.7% similarity with the one (PDB ID: 5nfy) of SARS (Figure 1). Thus, the 2019- nCoV NSP14 structures were modelled by using SARS NSP14 (PDB ID: 5nfy) as template. The N-terminus and C-terminus of 2019-nCoV NSP14 were designated as active sites for screening drugs. A total of 7496 drugs obtained in the ZINC database were subjected to the binding screening. Among them, 2100 drugs were approved by FDA, 4264 drugs were approved by other regulatory agencies besides FDA (world-not- FDA) and 1132 drugs are undergoing clinical trials but not yet approved (investigational-only). The docking was carried out using AutoDock Vina1.1.2. Ten top compounds showed the lowest negative vina score in a range of -8.6 to -9.7 kcal/mol were selected from the N-terminal domain of homology model (Table. 1), and eight top compounds with lowest negative vina score in a range of -8.7 to -9.7 kcal/mol were achieved from the C-terminal domain of homology model (Table. 2). More importantly, the compounds, including Saquinavir, Hypericin, Baicalein and Bromocriptine, not only could bind the N-terminus and C-terminus of the homology model (Figure 1. A, B), but also could bind the N- terminal and C-terminal active pockets of the 2019-nCoV Nsp14 (Figure 1. C, D).

chinaXiv:202002.00071v2

2. Materials and Methods 2.1 Docking method

The SARS NSP14 amino acid sequence was downloaded from the PDB protein structure database (PDB ID: 5nfy). The 2019-nCoV amino acid sequence (Accession number: MN908947) was obtained from database of the National Center for Biotechnology Information (NCBI). The homology of above amino acid sequence was aligned using ClustalW. Homology model of the target protein was constructed and optimized by Modeller9.18 using crystal structure of SARS NSP14 (PDB ID: 5nfy) as template. A total of 100 independent structures were constructed, and the one with best DOPE score was selected for further energy minimization by Amber.

The ligands were downloaded from the ZINC database (FDA, world-not-FDA, investigational-only, http://zinc.docking.org/substances/subsets/). The 2D structure of the compound was then converted into the corresponding 3D coordinates using the Babel server (http://openbabel.sf.net). Then the model was converted to pdbqt format by prepare_receptor4.py script with assigning atom type and partial charge. All rotatable bonds in the ligand were set as flexible for flexible docking. Vina1.1.2 was used for molecular docking. The docking boxes were selected at the N-terminal exonuclease domain (aa: 62-290) and C-termimal transmethylase domain (aa: 291-527) of 2019-nCoV NSP14 respectively.

2.2 Binding free energy calculation

Each simulation system was immersed in a cubic box of TIP3P water with 10 Å distance from the solute. The Na+ or Cl- was applied to neutralize the system. General Amber force field (GAFF) 15 and Amber ff14SB force field were used to parameterize the ligand and protein respectively. 10,000 steps of minimization with constraints (10 kcal/mol/Å2) on heavy atoms of complex, including 5,000 steps of steepest descent minimization and 5,000 steps of conjugate gradient minimization, was used to optimize each system. Then each system was heated to 300 K within 0.2 ns followed by 0.1 ns equilibration in NPT ensemble. Finally, 5 ns MD simulation on each system at 300 K

page4image9403584 page4image9392640

chinaXiv:202002.00071v2

was performed. The minimization, heating and equilibrium are performed with sander program in Amber18. The 5 ns production run was performed with pmemd.cuda. Based on the 5 ns MD simulation trajectory, binding free energy (ΔG) was calculated with MM/GBSA method according to the following equation: ΔGcal=ΔH- TΔS=ΔEvdw+ΔEele+ΔGgb+ΔGnp-TΔS, where ΔEele and ΔEVDW refer to electrostatic and van der Waals energy terms respectively. ΔGgb and ΔGnp refer to polar and non-polar solvation free energies respectively. Conformational entropy (TΔS) was not calculated for saving time. Besides, the ligands were compared based on the same target, so it is reasonable to ignore the entropy.

3. Results and Discussion
3.1 Docking results of Saquinavir against 2019-nCoV NSP14 model

Saquinavir, as the first FDA-approved HIV protease inhibitor, has been used in the treatment of patients with human immunodeficiency virus (HIV) infection since 1995 6. Our docking results showed that five of the hydrogen bonds involving ASP-273, ASN-252, ASP-90, and LEU-253 were maintained upon the binding of Saquinavir and N terminus of 2019-nCoV NSP14 (Fig. 1A). Meanwhile hydrogen bonds involving ASN-386, GLN-313, GLY-333 and THR-428 maintained upon the binding of Saquinavir and C terminus of 2019-nCoV NSP14 (Fig. 1C). Saquinavir could bind to the N- and C-terminal active pockets of the 2019-nCoV NSP14 (Fig. 1B, D). The recent study from a drug-target interaction deep learning model showed that Saquinavir can bind to 2019-nCoV RNA-dependent RNA polymerase to inhibit the enzyme activity7. Our simulation results showed that Saquinavir can bind two active sites of NSP14, thus Saquinavir could be as a candidate drug against 2019-nCoV for further research.

3.2 Docking results of Hypericin against 2019-nCoV NSP14 model

Hypericin as a main ingredient in traditional Chinese medicine- Hypericum perforatum L. (St. John’s wort) has been demonstrated activity against RNA viruses in

chinaXiv:202002.00071v2

vitro by inhibiting viral replication 8. The present docking results showe that three of the hydrogen bonds involving ASN-252, GLY-93, and HIS-268 are maintained upon the binding of Hypericin and N-terminus of 2019-nCoV NSP14 (Fig. 2A). The six hydrogen bonds involving ASN-306, ARG-310, ASN-422 and LY-336 are maintained upon the binding of Hypericin and C-terminus of it (Fig. 2C). Hypericin can bind to the N- and C-terminal active pockets of the 2019-nCoV Nsp14 (Fig. 2B, D). Hypericin has been proven to have inhibitory effects on human hepatitis C virus (HCV) and human immunodeficiency virus (HIV)9. Combined the present study, Hypericin may have potential antiviral effect against 2019-NcoV. The traditional Chinese medicine- Hypericum perforatum L as main composition of Shuanghuanglian oral liquid has been widely used for the treatment of viral influenza. However, Shuanghuanglian oral solution has been suggested for the treatment of 2019-nCoV, triggering a huge crisis of public trust in Chinese scientists. We suggested that anti-2019-nCoV effects of Hypericin should be detected in cell culture models of 2019-nCoV infection. This will help us have a good understanding whether it is a good method to use Chinese medicines for the treatment of 2019-nCoV or not.

3.3 Docking results of Baicalein against 2019-nCoV NSP14 model

Baicalein, a flavonoid compound isolated from the root of Scutellaria baicalensis Georgi (Huang Qin in Chinese), inhibit viral replication of parainfluenza, influenza A, hepatitis B, HIV-1, and SARS coronavirus 10-12. The present docking results showed that six of the hydrogen bonds involving ASN-266, ASP-273, GLY-93, GLU-92, and HIS-268 were maintained upon the binding of Hypericin and N-terminus of 2019-nCoV NSP14 (Fig. 2A). Four hydrogen bonds involving ASN-386, ASP-331, and GLN-313 are maintained upon the binding of Hypericin and C-terminus of it (Fig. 2C). Baicalein can also bind to the N- and C-terminal active pockets of the 2019-nCoV NSP14 (Fig. 2B, D). The previous study showed that Baicalein as a novel chemical inhibitor could inhibit ATPase activity of NSP13 protein of SARS coronavirus 13. The present data suggests that Baicalin may bind to NSP14 protein to exert anti-2019-nCoV activity.

chinaXiv:202002.00071v2

Therefore, we suspect that the anti-2019-nCoV activity induced by the Baicalein could be valuable for further study.

3.4 Docking results of Bromocriptine against 2019-nCoV NSP14 model

Bromocriptine, a specific dopamine receptor agonist for the hypothalamus and pituitary, has inhibitory effect on replication the Dengue virus with low cytotoxicity (half maximal effective concentration, EC50=0.8-1.6 μM; and half maximal cytotoxicity concentration, CC50=53.6 μM) 14. Moreover, Bromocriptine inhibited Zika virus protease activities and exhibited synergistic effects with interferon-α2b against Zika virus replications15. It is interesting to find that Bromocriptine can bind to the N- and C-terminal active pockets of the 2019-nCoV NSP14 from our molecular docking results (Fig. 4B, D). The present results showed that three of the hydrogen bonds involving ASN-104, ASP-273 and GLN-145 were maintained upon the binding of hypericin and N terminus of 2019-nCoV NSP14 (Fig. 4A). There was one bond involving THR-428 maintained upon the binding of hypericin and C terminus of it (Fig. 4C).

3.5 The calculation of binding free energy

Based on the 5 ns MD simulation trajectory, binding free energy (ΔG) was calculated by MM/GBSA method. The calculated binding free energies of Saquinavir, Hypericin, Baicalein and Bromocriptine for the N-terminus of the homology model were -37.2711±3.2160, -30.1746±3.1914, -23.8953±4.4800, -34.1350±4.3683 kcal/mol, respectively (Table 3), while the calculated binding free energies were – 60.2757±4.7708, -30.9955±2.9975, -46.3099±3.5689, -59.8104±3.5389 respectively, when binding to the C-terminus (Table 4). Taken together, the results demonstrated that Saquinavir had the strong binding free energy.

4. Conclusion

2019-nCoV NSP14, a bifunctional enzyme carrying RNA cap guanine N7-

chinaXiv:202002.00071v2

methyltransferase and 3′-5′ exoribonuclease activities could be a potential drug target for intervention. 2019-nCoV NSP 14 shares 98.7% sequence similarity with the corresponding one in SARS. Thus, the homology models of 2019-nCoV NSP14 was structured for virtual screening. Based on the docking score, 18 drugs were selected for further evaluations. Four drugs (Saquinavir, Hypericin, Baicalein and Bromocriptine) could bind to the N-terminal and C-terminal domains of 2019-nCoV NSP 14. Combined the anti-viral function of above four drugs reported by the published literatures, we suggest the anti-2019-nCoV effects of above four drugs should be evaluated in the cell culture models of 2019-nCoV infection.

Acknowledgments

This work was supported by grants from the National Natural Science Foundation of China (NO. 31870135, 31600116) and the “1000 Talent Plan” of Sichuan Province (NO. 980).

References

1. Snijder EJ, Decroly E, Ziebuhr J. The Nonstructural Proteins Directing Coronavirus RNA Synthesis and Processing. Adv Virus Res 2016; 96: 59‐126.
2. Sawicki SG, Sawicki DL, Siddell SG. A contemporary view of coronavirus transcription. J Virol 2007; 81(1): 20‐9.

3. Chen Y, Tao J, Sun Y, et al. Structure‐function analysis of severe acute respiratory syndrome coronavirus RNA cap guanine‐N7‐methyltransferase. J Virol 2013; 87(11): 6296‐305.
4. Eckerle LD, Lu X, Sperry SM, Choi L, Denison MR. High fidelity of murine hepatitis virus replication is decreased in nsp14 exoribonuclease mutants. J Virol 2007; 81(22): 12135‐44.

5. Chen Y, Cai H, Pan J, et al. Functional screen reveals SARS coronavirus nonstructural protein nsp14 as a novel cap N7 methyltransferase. Proc Natl Acad Sci U S A 2009; 106(9): 3484‐9.
6. Kitchen VS, Skinner C, Ariyoshi K, et al. Safety and activity of saquinavir in HIV infection. Lancet 1995; 345(8955): 952‐5.

7. Beck BR, Shin B, Choi Y, Park S, Kang K. Predicting commercially available antiviral drugs that may act on the novel coronavirus (2019‐nCoV), Wuhan, China through a drug‐target interaction deep learning model. bioRxiv 2020.
8. Karioti A, Bilia AR. Hypericins as potential leads for new therapeutics. Int J Mol Sci 2010; 11(2): 562‐94.

9. Lenard J, Rabson A, Vanderoef R. Photodynamic inactivation of infectivity of human

page8image8456448

chinaXiv:202002.00071v2

immunodeficiency virus and other enveloped viruses using hypericin and rose bengal: inhibition of fusion and syncytia formation. Proc Natl Acad Sci USA 1993; 90(1): 158‐62.
10. Zhang G‐H, Wang Q, Chen J‐J, Zhang X‐M, Tam S‐C, Zheng Y‐T. The anti‐HIV‐1 effect of scutellarin. Biochem Biophys Res Commun 2005; 334(3): 812‐6.

11. Sithisarn P, Michaelis M, Schubert‐Zsilavecz M, Cinatl J. Differential antiviral and anti‐inflammatory mechanisms of the flavonoids biochanin A and baicalein in H5N1 influenza A virus‐infected cells. Antiviral Res 2013; 97(1): 41‐8.
12. Hour MJ, Huang SH, Chang CY, et al. Baicalein, Ethyl Acetate, and Chloroform Extracts of Scutellaria baicalensis Inhibit the Neuraminidase Activity of Pandemic 2009 H1N1 and Seasonal Influenza A Viruses. Evid Based Complement Alternat Med 2013; 2013: 750803.

13. Keum Y‐S, Lee JM, Yu M‐S, Chin Y‐W, Jeong Y‐JJBotKCS. Inhibition of SARS Coronavirus Helicase by Baicalein. 2013; 34(11): 3187‐8.
14. Kato F, Ishida Y, Oishi S, et al. Novel antiviral activity of bromocriptine against dengue virus replication. Antiviral Res 2016; 131: 141‐7.

15. Chan JF, Chik KK, Yuan S, et al. Novel antiviral activity and mechanism of bromocriptine as a Zika virus NS2B‐NS3 protease inhibitor. Antiviral Res 2017; 141: 29‐37.

chinaXiv:202002.00071v2

Figure and Table legends

Figure 1. The binding model of Saquinavir against 2019-nCoV NSP14. (A) Interactions between Saquinavir (cyan) and associated residues (off-white) in the N-terminus of the homology model for 2019-nCoV; (B) Binding models of Saquinavir (cyan) in the 2019-nCoV NSP14 protein N-terminus pocket (white surface); (C) Interactions between Saquinavir (cyan) and associated residues (off- white) in the C-terminus of the homology model for 2019-nCoV; (D) Binding models of Saquinavir (cyan) in the 2019-nCoV NSP14 protein C-terminus pocket (white surface). Numbers accompanying dashed yellow lines represents the interaction distance (Å).

page10image6833168 page10image6847936

chinaXiv:202002.00071v2

page11image6833376 page11image6842320page11image6832336

Figure 2. The binding model of Hypericin against 2019-nCoV NSP14. (A) Interactions between Hypericin (cyan) and associated residues (off-white) in the N-terminus of the homology model for 2019-nCoV; (B) Binding models of Hypericin (cyan) in the 2019-nCoV NSP14 protein N-terminus pocket (white surface); (C) Interactions between Hypericin (cyan) and associated residues (off- white) in the C-terminus of the homology model for 2019-nCoV; (D) Binding models of Hypericin (cyan) in the 2019-nCoV NSP14 protein C-terminus pocket (white surface). Numbers accompanying dashed yellow lines represents the interaction distance (Å).

chinaXiv:202002.00071v2

page12image6835872 page12image6836080

Figure 3. The binding model of Baicalein against 2019-nCoV NSP14. (A) Interactions between Baicalein (cyan) and associated residues (off-white) in the N-terminus of the homology model for 2019-nCoV; (B) Binding models of Baicalein (cyan) in the 2019-nCoV NSP14 protein N-terminus pocket (white surface); (C) Interactions between Baicalein (cyan) and associated residues (off-white) in the C-terminus of the homology model for 2019-nCoV; (D) Binding models of Baicalein (cyan) in the 2019-nCoV NSP14 protein C-terminus pocket (white surface). Numbers accompanying dashed yellow lines represents the interaction distance (Å).

chinaXiv:202002.00071v2

page13image7271632 page13image7266016

s
Figure 4. The binding model of Bromocriptine against 2019-nCoV NSP14. (A) Interactions between Bromocriptine (cyan) and associated residues (off-white) in the N-terminus of the homology model for 2019-nCoV; (B) Binding models of Bromocriptine (cyan) in the 2019-nCoV NSP14 protein N- terminus pocket (white surface); (C) Interactions between Bromocriptine (cyan) and associated residues (off-white) in the C-terminus of the homology model for 2019-nCoV; (D) Binding models of Bromocriptine (cyan) in the 2019-nCoV NSP14 protein C-terminus pocket (white surface).

Numbers accompanying dashed yellow lines represents the interaction distance (Å).

chinaXiv:202002.00071v2

Table 1 –Ten drugs selected from the N-terminal domain of homology model

Table 1 –Ten drugs selected from the N-terminal domain of homology model

Drug name ID Data Affinity (kcal/mol)

Hypericin ZINC000003780340 Investigational-only -9.7

Bromocriptine ZINC000053683151 FDA -9.4

Tanespimycin ZINC000100014666 Investigational-only -9.1

Idarubicin ZINC000003920266 FDA -9.1

Emend ZINC000027428713 FDA -8.9

Baicalein ZINC000034114798 World-not- FDA -8.8

Saquinavir ZINC000029416466 FDA -8.7

Delavirdine ZINC000018516586 FDA -8.7

Silibinin ZINC000001530850 Investigational-only -8.6

Golvatinib ZINC000043195317 Investigational-only -8.6

Table 2 –Eight drugs selected from the C-terminal domain of homology model

Table 2 –Eight drugs selected from the C-terminal domain of homology model

Drug name ID Data Affinity (kcal/mol)

Hypericin ZINC000003780340 Investigational-only -9.7

Olysio ZINC000164760756 FDA -9.4

Sovaprevir ZINC000085537149 Investigational-only -9.1

Celsentri ZINC000003817234 FDA -9.1

Saquinavir ZINC000003914596 FDA -8.9

Maraviroc ZINC000101160855 World-not-FDA -8.8

Baicalein ZINC000034114798 World-not- FDA -8.7

Bromocriptine ZINC000053683151 FDA -8.7

chinaXiv:202002.00071v2

Table 3 –The calculated binding energies of ligand to the N-terminus of 2019-nCoV NSP14

Table 3 –The calculated binding energies of ligand to the N-terminus of 2019-nCoV NSP14

Energy* Saquinavir Hypericin Baicalein Bromocriptine

ΔEvdw -52.9602±2.9999 -36.4737±4.0922 -36.8721±3.4155 -45.8461±3.1764

ΔEele -128.6886±21.2732 -78.5578 ±10.7496 -47.8615±12.4900 -119.9028±8.3707

ΔGgb 151.4060±21.5835 90.4227±7.8130 66.0255±11.0420 137.397±6.4239

ΔGnp -7.0283±0.3128 -5.5659±0.2085 -5.1872±0.2001 -5.7839±0.2553

ΔGcal -37.2711±3.2160 -30.1746±3.1914 -23.8953±4.4800 -34.1350±4.3683

* ΔEvdw = van der Waals energy terms; ΔEele = electrostatic energy; ΔGgb = polar solvation free energy; ΔGnp = nonpolar solvation free energy; ΔGcal = final estimated binding free energy calculated from the above terms (kCal/mol).

Table 4 –The calculated binding energies of ligand to the C-terminus of 2019-nCoV NSP14

Table 4 –The calculated binding energies of ligand to the C-terminus of 2019-nCoV NSP14

Energy* Saquinavir Hypericin Baicalein Bromocriptine

ΔEvdw -70.4383±4.1035 -45.729±2.4822 -48.6473±3.5522 -61.4659±2.9431

ΔEele -38.8487±7.5603 -58.4555±12.1238 -192.8463±18.1708 -62.3583±7.0875

ΔGgb 57.7780±6.3018 78.5444±10.3832 202.1598 ±16.7035 70.6739±5.6693

ΔGnp -8.7666±0.3476 -5.3546±0.2317 -6.9761± 0.1614 -6.6602±0.2480

ΔGcal -60.2757±4.7708 -30.9955±2.9975 -46.3099±3.5689 -59.8104±3.5389

chinaXiv:202002.00071v2


Posted in Most Recent | Leave a comment

Clinical remission of a critically ill COVID-19 patient treated by human umbilical cord mesenchymal stem cells

Clinical remission of a critically ill COVID-19 patient treated by human umbilical cord mesenchymal stem cells

Bing Liang1,#, Junhui Chen2,#, Tao Li3,#, Haiying Wu4,#, Wenjie Yang1,#, Yanjiao Li5, Jianchun Li1, Congtao Yu2, Fangang Nie1, Zhaoxia Ma5, Mingxi Yang1, Panrong Nie6, Yanfeng Gao2,7,*, Chuanyun Qian4,*, Min Hu2,5,8,*

1 Department of Critical Care Medicine, Baoshan People’s Hospital, Baoshan 678000, China
2 Intervention and Cell Therapy Center, Peking University Shenzhen Hosptial, Shenzhen 518035, China
3 Yunnan Yasheng Medical Technology Co., Ltd., Kunming 650021, China
4 Emergency Department of the First Affiliated Hospital of Kunming Medical University, EICU/MICU, Kunming 650032, China
5 Yunnan Key Laboratory for Basic Research on Bone and Joint Diseases & Yunnan Stem Cell Translational Research Center, Kunming University, Kunming 650214, China
6 Department of Neonatology, Baoshan People’s Hospital, Baoshan, 678000, China
7 School of Pharmaceutical Sciences (Shenzhen), Sun Yat-sen University, Shenzhen 517108, China
8 Yunnan Jici Institute for Regenerative Medicine co., Ltd., Kunming 650106, China

# These authors contribute equally.
* Correspondence to: E-mail: huminynkm@163.com (Hu M.); qianchuanyun@126.com (Qian

C.); yfgao@hotmail.com (Gao Y.)

1

chinaXiv:202002.00084v1

Abstract

Background

The COVID-19 cases increased very fast in the last two months. The mortality among critically ill patients, especially the elder ones, was relatively high. Considering that most of the dead patients were caused by severe inflammation response, it is very urgent to develop effective therapeutic agents and strategies for these patients. The human umbilical cord mesenchymal stem cells (hUCMSCs) have shown very good capability to modulate immune response and repair the injured tissue with good safety.

Case Presentation

Here, we reported the treatment process and clinical outcome of a 65-year-old female critically ill COVID-19 patient infected with 2019-nCoV (now called SARS-CoV-2). The significant clinical outcome and well tolerance was observed by the adoptive transfer of allogenic hUCMSCs.

Conclusions

Our results suggested that the adoptive transfer therapy of hUCMSCs might be an ideal choice to be used or combined with other immune modulating agents to treat the critically ill COVID- 19 patients.

Keyword: COVID-19; 2019 novel coronavirus, critically ill, mesenchymal stem cell

2

chinaXiv:202002.00084v1

Background

In December 2019, the outbreak of 2019 novel coronavirus (now called SARS-CoV-2) infected pneumonia (COVID-19) began in Wuhan, China. As of 22th Feb. 2020, 2019 novel coronavirus had infected 76392 people in China (among which 2348 were killed) and 1404 people in other twenty-seven countries and regions (among which twelve people were killed) [1]. It was reported that the elder patients were inclined to get more severe symptom, and the ICU admission ratio of them was significantly than the younger. Including the ground glass opacity in the lung, the other typical diagnosis characteristic of the critically ill patients was significant decrease in lymphocytes along with the increase of neutrophils. The ICU admission patients have higher concentrations of IL-6, G-CSF, IP10, MCP-1, MIP1A, and TNF-α, indication the occurrence of cytokine storm [2, 3]. Persistence of cytokine storm will thus cause the severe organ injury and death [4]. There are no good choice to overcome the cytokine storm, these critically ill patients were always treated with glucocorticoid. But in most cases, the treatment of glucocorticoid will cause severe side effects including osteoporosis and hypoimmunity, or even delay the clearance of the virus [2, 5]. Therefore, it is very urgent to discover novel strategies to treat these critically ill patients [6].

Mesenchymal stem cells (MSCs) have been widely used to treat type 2 diabetes, autoimmune disease, spinal cord injury, GVHD, and other diseases with very good safety [7, 8]. Among which, the umbilical cord mesenchymal stem cells (hUCMSCs) can be easily get and cultured. hUCMSCs have shown very significant immunomodulation and tissue repair effects with low immunogenicity, which makes them very ideal candidate to the allogenic adoptive transfer therapy. It was also suggested to be potential to treat the H5N1 infection induced acute lung injury, which showed similar inflammatory cytokine profile to that of COVID-19 [9]. Up to now, the therapeutic effects of MSCs on COVID-19 have not been reported yet.

Here, we will introduce a critically ill elder female patient in China infected with 2019 novel coronavirus. The characteristics of the vital signs, CT images, clinical laboratory profiles, and major immune cell changes will be investigated. The clinical outcome of hUCMSCs adoptive transfer therapy will be also discussed.

Case Presentation

3

chinaXiv:202002.00084v1

On January 27, 2020, a 65-year-old woman felt fatigue and fever with a body temperature of 38.2oC, then cough with small amount of white bubble sputum. Considering that she had flown from Wuhan on January 21, 2020, she was immediately sent to the Longling People’s Hospital, and the throat swabs were collected. Then, antibiotics and phlegm reducing drugs were given for supportive treatment. On January 28, she had chest tightness with SPO2 of 81%, and blood pressure 160/91 mmHg. On the same day, the real-time RT-PCR result reported 2019 novel coronavirus positive, and X-ray examination showed ground glass opacity in the right lung. IFN-α inhalation treatment was performed. On January 29 morning, she felt chest tightness and more difficult to breathe, along with shortness of breath. In the afternoon, she was admitted to the infectious disease department of the Baoshan People’s Hospital (a tertiary hospital near Longling County) for better treatment.

On January 29, the clinical laboratory examination showed that the white blood cell count was in normal range, but the neutrophil percentage was increased to 87.9%, along with the lymphocyte percentage decreased to 9.8%. According to the guideline for the diagnosis and treatment of 2019 novel coronavirus infected pneumonia (Trial 4th Edition), the patient was treated with antiviral therapy of lopinavir/ritonavir, IFN-α inhalation and oseltamivir (oseltamivir was withdrawn after once administration), and also intravenous injection of moxifloxacin, Xuebijing, methylprednisolone, and immunoglobulin. To reduce hypoxia and prevent respiratory muscle fatigue of the patient, the non-invasive mechanical ventilator was used under the advice and guidance of hospital specialist group.

On January 30, the patient could breathe easily under the ventilator, along with normal body temperature but paroxysmal cough. Considering that she got a severe diarrhea from January 30 night to January 31 morning, electrolyte replacement and rehydration were given for supportive treatment. In case of reducing the blood glucose level (postprandial glucose level around 9.6- 14.6 mM), insulin was given intramuscularly. On January 31, the diarrhea symptom reduced significantly, but the patient showed severe electrolyte disturbance. The white blood cell count increased to 12.16×10⁹/L, among which the neutrophil percentage increased to 92.4%. The C- reaction protein increased to 44.64mg/L, along with erythrocyte sedimentation rate increased to 88mm/h. Under the cooperation of multi-discipline team, the patient was diagnosed as

critically ill type COVID-19 along with acute respiratory failure and acute diarrhea. Diabetes

4

chinaXiv:202002.00084v1

and hypertension remained to be further determined.
On February 1, the patient showed no diarrhea and no shortness of breath when stay calmly,

but with paroxysmal cough and small amount of white sputum. The white blood cell count continuously increased to 13.92×10⁹/L, among which the neutrophil percentage increased to 95.1% and lymphocyte decreased to 2.9%. From February 1 evening to February 2 morning, the patient began to breathe fast with a respiratory rate of 35-44/min, which could not be improved by adjusting the parameter of the ventilator. The blood oxygen saturation was continuously lower than 86‒90%. Under the guidance of the COVID-19 specialist team, the patient was urgently transferred to the ICU, and invasive tracheal cannula was performed to decrease the respiratory distress.

From February 2 to 4, the white blood cell count slightly decreased, among which the percentage of neutrophil increased to 82.2% and lymphocyte to 12.5% (both were still abnormal). In the early morning of February 4, the patient got a gastrorrhagia with a liquid amount around 230mL. Considering the low levels of red blood cell count and hemoglobin, anemia symptom was shown which might be caused by immune or inflammation related hemolysis. To modulate immune cell ratio, thymosin α1 was given from February 3. Although a blood transfusion was performed on February 4, the red blood cell count (2.76×10¹²/L) and hemoglobin concentration (92.00g/L) were still very low on February 5. On February 6, the serum bilirubin continuously increased, with the concentrations of DBil to 43.8μM and I-Bil to 29.5μM, indicating liver injury possibility. The concentrations of CRP (82.69mg/L), PCT (0.102ng/mL), D-Dimer (4.76 μg/mL), and ProBNP (670.2pg/mL) were very high. Although the white cell count was in normal range (8.38×10⁹/L), but the neutrophil percentage began to increase again to a very high level (92.4%). All these results indicated that the anti- inflammatory effects of glucocorticoid, antiviral drugs and antibiotics might not work very well, and the gastrorrhagia was suspected to be caused by the side effects of glucocorticoid.

On February 7, considering the severe organ injury caused by inflammatory response and side effects, the glucocorticoid and antiviral therapy were withdrawn under the advice and guidance of the specialist group. The hUCMSCs adoptive transfer therapy was proposed. On February 8, the physical condition of the patient was re-evaluated. It was confirmed that she

was critically ill type COVID-19, with severe pneumonia (mixed type), acute respiratory

5

chinaXiv:202002.00084v1

distress, multi-organ injury (liver, respiratory system, and blood), moderate anemia, hypertension, type 2 diabetes, electrolyte disturbance, immunosuppression, acute gastrointestinal bleeding, and other symptoms. The family member and patient agreed to try hUCMSCs adoptive transfer therapy. The therapeutic scheme was then discussed and approved by the ethics committee of the hospital and consent forms were signed by the family member before the therapy.

Discussion

As shown in Figure 1, the allogenic hUCMSCs produced under GMP condition were administrated intravenously for three times (5×10⁷cells each time) on February 9, 12, and 15. During the therapy, antibiotics were given to prevent infection, and thymosin α1 was also given. After the first time adoptive transfer, no obvious side effects were observed, indicating it was well tolerated. As shown in Table 1, after the second administration, the serum bilirubin, CRP, and ALT/AST were gradually reduced, along with some other vital signs were also improved. The trachea cannula was also pulled off and the patient could ambulate on the ground from February 13 as well. As shown in Figure 2, after the second administration, the white blood cell count and neutrophil count decreased to the normal level, along with the lymphocyte count increased to normal level as well. More importantly, the counts of CD3+ T cell, CD4+ T cell, and CD8+ T cell were also remarkably increased to normal levels. It was also suggested that the immune modulating effects of thymosin α1 alone (From day 7 to day 12 in Figure 2) might be not very significant, indicating that hUCMSCs or combined with thymosin α1 could greatly reduce the inflammation response and help the recovery of antiviral immune cells and organs. Considering the characteristics of hUCMSCs, we speculated that they might homing to repair the injured tissues and neutralize the inflammatory cytokines (such as G-CSF and IL-6) by the expression of their receptors.

As shown in Figure 3, by comparing the chest CT images taken on January 29 to February 16 and February 21, it can be seen that the pneumonia was greatly relieved. On February 17, the patient was transferred out of ICU, and most of the vital signs and clinical laboratory indexes recovered to normal level. The throat swabs tests reported negative on both February 17 and February 19.

6

chinaXiv:202002.00084v1

Conclusions

As a conclusion, we proposed that the adoptive transfer therapy of hUCMSCs might be an ideal choice to be used or combined with other immune modulating agents. Although only one case was shown here, it would also be very important to inspire more similar clinical practice to treat such critically ill COVID-19 patients.

Ethical Approval and Consent to participate

The study was approved by the Ethics Committee of the Baoshan People’s Hospital and informed consent was confirmed by the participants.

Consent for publication

Informed consent for publication was obtained from all authors and participants.

Availability of supporting data

The data supporting the results were included within the article.

Competing interests

All authors declare no competing interests.

Funding

This study was supported by the grants from Shenzhen Municipal Health Commission (SZSM201612071), the Ministry of Science and Technology of China (YCZYPT[2018] 03-1), and the Yunnan Science & Technology (2016RA093, 2018ZF007-03, 2019ZF002).

Authors’ contributions

Liang B., Li T., and Hu M. had full access to all of the data in the study and take responsibility for the accuracy of the data. Chen J. Wu H. and Qian C. analyzed the data. Gao Y. wrote the manuscript. Yang W., Li Y., Li J., Nie F., Ma Z., Yang M., and Nie P. participated the study and help to collect the data.

7

chinaXiv:202002.00084v1

Acknowledgements

We thank the grants supported by the Shenzhen Municipal Health Commission (SZSM201612071), the Ministry of Science and Technology of China (YCZYPT[2018] 03-1), and the Yunnan Science & Technology (2016RA093, 2018ZF007-03, 2019ZF002).

Authors’ information

Bing Liang#, Wenjie Yang#, Jianchun Li, Fangang Nie, Mingxi Yang
Department of Critical Care Medicine, Baoshan People’s Hospital, Baoshan 678000, China Junhui Chen#, Congtao Yu
Intervention and Cell Therapy Center, Peking University Shenzhen Hosptial, Shenzhen 518035, China
Tao Li#
Yunnan Yasheng Medical Technology Co., Ltd., Kunming 650021, China
Haiying Wu#, Chuanyun Qian*
Emergency Department of the First Affiliated Hospital of Kunming Medical University, EICU/MICU, Kunming 650032, China
Yanjiao Li, Zhaoxia Ma
Yunnan Key Laboratory for Basic Research on Bone and Joint Diseases & Yunnan Stem Cell Translational Research Center, Kunming University, Kunming 650214, China
Panrong Nie
Department of Neonatology, Baoshan People’s Hospital, Baoshan, 678000, China
Yanfeng Gao*
School of Pharmaceutical Sciences (Shenzhen), Sun Yat-sen University, Shenzhen 517108, China; Intervention and Cell Therapy Center, Peking University Shenzhen Hosptial, Shenzhen 518035, China
Min Hu*
Yunnan Key Laboratory for Basic Research on Bone and Joint Diseases & Yunnan Stem Cell Translational Research Center, Kunming University, Kunming 650214, China; Intervention and

Cell Therapy Center, Peking University Shenzhen Hosptial, Shenzhen 518035, China; Yunnan

8

chinaXiv:202002.00084v1

Jici Institute for Regenerative Medicine co., Ltd., Kunming 650106, China

# These authors contribute equally.
* Correspondence to: E-mail: huminynkm@163.com (Hu M.); qianchuanyun@126.com (Qian

C.); yfgao@hotmail.com (Gao Y.)

References

  1. Data were cited from https://news.qq.com/zt2020/page/feiyan.htm.
  2. HuangC,WangY,LiX,RenL,ZhaoJ,HuY,ZhangL,FanG,XuJ,GuX,ChengZ,YuT,XiaJ,Wei

    Y, Wu W, Xie X, Yin W, Li H, Liu M, Xiao Y, Gao H, Guo L, Xie J, Wang G, Jiang R, Gao Z, Jin Q, Wang J, Cao B. Clinical features of patients infected with 2019 novel coronavirus in Wuhan, China. Lancet. 2020; doi: 10.1016/S0140-6736(20)30183-5.

  3. WangD,HuB,HuC,ZhuF,LiuX,ZhangJ,WangB,XiangH,ChengZ,XiongY,ZhaoY,LiY,Wang X, Peng Z. Clinical Characteristics of 138 Hospitalized Patients With 2019 Novel Coronavirus-Infected Pneumonia in Wuhan, China. JAMA. 2020; doi: 10.1001/jama.2020.1585.
  4. XuZ,ShiL,WangY,ZhangJ,HuangL,ZhangC,LiuS,ZhaoP,LiuH,ZhuL,TaiY,BaiC,GaoT, Song J, Xia P, Dong J, Zhao J, Wang F. Pathological findings of COVID-19 associated with acute respiratory distress syndrome. Lancet Respir Med. 2020; Pii: S2213-2600(20)30076-X.
  5. Shang L, Zhao J, Hu Y, Du R, Cao B. On the use of corticosteroids for 2019-nCoV pneumonia. Lancet. 2020; pii: S0140-6736(20)30361-5.
  6. Zumla A, Hui DS, Azhar EI, Memish ZA, Maeurer M. Reducing mortality from 2019-nCoV: host- directed therapies should be an option. Lancet. 2020; doi: 10.1016/S0140-6736(20)30305-6.
  7. Le Blanc K, Rasmusson I, Sundberg B, Götherström C, Hassan M, Uzunel M, Ringdén O. Treatment of severe acute graft-versus-host disease with third party haploidentical mesenchymal stem cells. Lancet. 2004; 363(9419):1439-41.
  8. Fan XL, Zhang Y, Li X, Fu QL. Mechanisms underlying the protective effects of mesenchymal stem cell-based therapy. Cell Mol Life Sci. 2020; doi:10.1007/s00018-020-03454-6.
  9. Darwish I, Mubareka S, Liles WC. Immunomodulatory therapy for severe influenza. Expert Rev Anti Infect Ther. 2011; 9(7):807-22.

9

chinaXiv:202002.00084v1

page10image6817824

Figure 1. The major symptoms and treatment of the critically ill COVID-19 patient

chinaXiv:202002.00084v1

Table 1. The major clinical laboratory characteristics of the patient

page11image8442560

Days after disease onset
range 3 6 8 10 12 13* 14 16* 17 19* 21

Normal

Creatinine (μM)

Ibil (μM)

Albumin (g/L)

AST (U/L)

PCT (ng/mL)

proBNP (pg/mL)

41-81

1.7-21

40-55

13-35

0-0.05

0-325

48 52.8 39.1 40.7

4.41 10.93 11.8 29.5 14.1

34 30.7 45.7 39.2 38.4

30.3 21.9 19.4 20.6 23.8

0.01 0.01 0.049 0.102

4.012 151.7 629.9 670.2 373

33.6 41.5

12.5 13.2

38.8 41.5

38.3 45.8

0.07 0.161

41.1 40.8 49.1

page11image8443328

Dbil (μM) 0-8 2.8 12.6 6.8 43.8 14.5 11 9.9 6.6 6.6 5.9

8.4 9.8

11.90

page11image8443520

Tbil (μM) ≤21 7.22 23.53 18.6 73.3 28.6 23.5 23.1 15 16.4 17.8

41.6 43.3 42.4

31.7 26.1 19.9

0.153 0.047

153.1

page11image8443712

ALT (U/L)

7-40 25.3 21.1 18.2 22.7 25.3 37.1 53.5 45.4 37 25.7

page11image8900928

CRP (mg/L)

0-3 69.68 34.61 82.69 22.63 33.2 35.58 27.9 11.93

page11image8897472

D-dimer (μg/mL)

0-0.5 2.63 2.28 4.76 2.23 2.08 2.56 2.01 2.16 1.34

page11image23260096

* Indicates the day of hUCMSCs therapy

chinaXiv:202002.00084v1

page12image6821152 page12image6828640 page12image6828432 page12image6825104

Figure 2. The dynamic changes of the immune cell counts of the patient. The arrows indicate the day of hUCMSCs therapy. To the white blood cell (normal range 3.5‒9.5×10⁹/L) and neutrophil (normal range 1.8‒6.3×10⁹/L), the dash line indicates upper threshold. While to the lymphocyte (normal range 1.1‒3.2×10⁹/L) and T cell subsets, the dash line indicates lower threshold.

chinaXiv:202002.00084v1

page13image6845856

Figure 3. The typical CT images of the lung. A1-A3) CT images on January 29 indicate that there are lesions and mass density increasing shadow in both left and right lung. The ground- glass opacity, nonhomogeneous density, and air bronchus can be seen in the right lung. B1-B3) CT images on February 16 indicate the significant relief in both left and right lung. Only some Stripe shadow and small pieces of ground-glass opacity can be seen. C1-C3) CT images on February 21 indicate the further relief in both left and right lung. Most of the ground-glass opacity lightened, or even disappeared.


Posted in Most Recent | Leave a comment